

ISO/TS 8000-230:2026
(Main)Data quality — Part 230: Sensor data — Guidelines for data cleansing
- Abstract
This document specifies guidelines to improve data quality by cleansing sensor data anomalies that affect low inherent quality characteristics. The following are within the scope of this document: principles for sensor data cleansing; the process for sensor data cleansing; implementation requirements for sensor data cleansing; list of data anomaly detection and repair methods (see Annex B); examples of sensor data cleansing (see Annex C). The following are outside the scope of this document: algorithms or detailed methods to detect and repair data anomalies; the process of sensor data cleansing for real time processing.
- Status
- Published
- Publication Date
- 25-May-2026
- Technical Committee
- ISO/TC 184/SC 4 - Industrial data
- Drafting Committee
- ISO/TC 184/SC 4/WG 13 - Industrial Data Quality
- Current Stage
- 6060 - International Standard published
- Start Date
- 26-May-2026
- Due Date
- 29-Jul-2026
- Completion Date
- 26-May-2026


ISO/TS 8000-230:2026 is an ISO Technical Specification that gives guidelines for cleansing sensor data anomalies that affect low inherent quality characteristics. It specifies the principles, process, and implementation requirements for sensor data cleansing, and it supports organizations that want better sensor data before data analysis or exploitation. The document is written for offline processing and points readers to methods and examples in its annexes.
What does ISO/TS 8000-230:2026 specify?
ISO/TS 8000-230:2026 specifies how to improve the quality of sensor data by detecting and repairing data anomalies. It focuses on sensor data cleansing as a structured activity, not on the detailed design of detection or repair algorithms.
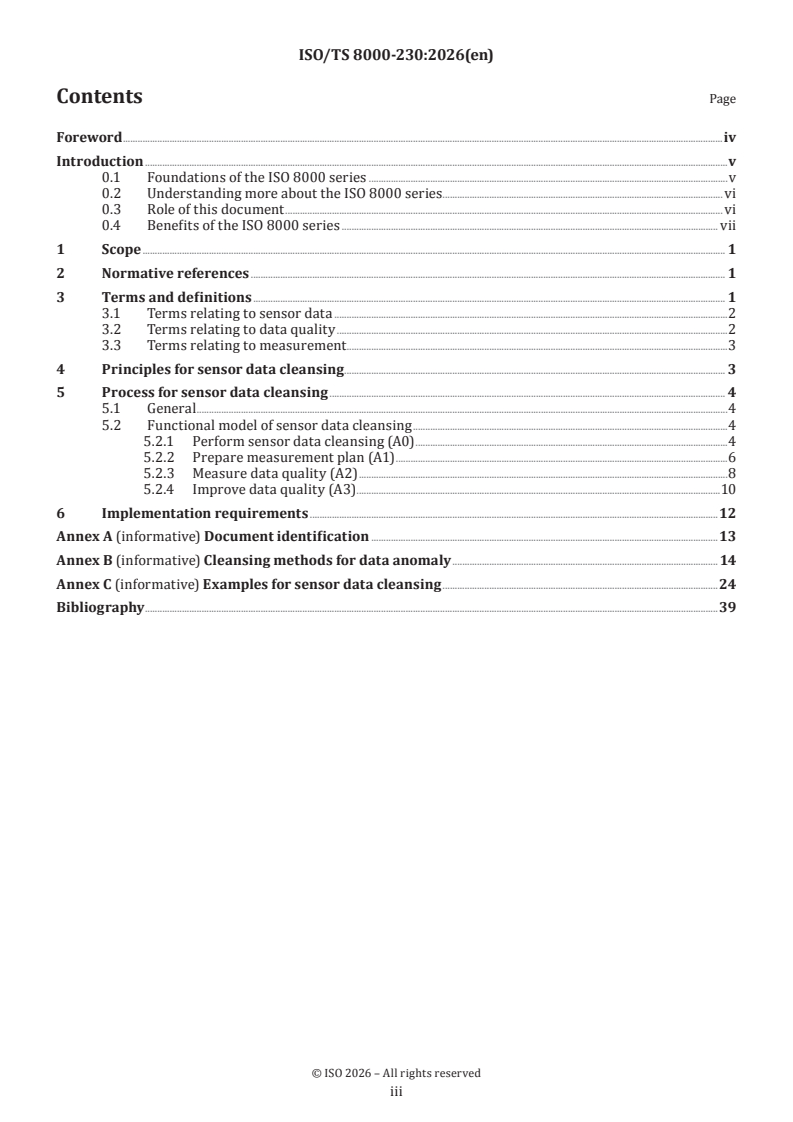
The document is organized into six clauses and three informative annexes.
| Annex | What it covers |
|---|---|
| Annex A | Document identification for open information systems |
| Annex B | Cleansing methods for data anomaly, including detection and repair approaches |
| Annex C | Examples for sensor data cleansing using TBM sensor data |
Clause 1 states the scope. Clause 2 lists the normative references. Clause 3 gives terms and definitions. Clause 4 sets out principles for sensor data cleansing. Clause 5 describes the cleansing process. Clause 6 gives implementation requirements.
What are the key requirements of ISO/TS 8000-230:2026?
ISO/TS 8000-230:2026 turns sensor data cleansing into a controlled process: define the quality goal, measure the data, and then repair anomalies only when that is justified. In practice, that means the document helps an organization decide what to fix, how to judge improvement, and when to stop.
Principles for sensor data cleansing
Clause 4 gives five practical principles.
- If an anomaly comes from sensor or system errors, the data should be improved by deleting or modifying the anomalous data. This matters because technical faults are the main case where cleansing is appropriate.
- If an anomaly reflects a real field phenomenon, the decision to keep, delete, or modify it depends on the intended or specified use. This matters because the same data can be correct for one purpose and wrong for another.
- If the cause is unclear, deletion or modification should be minimized. This protects original correct data from unnecessary change.
- If the anomaly cannot be deleted or modified, the data should be flagged or marked. That lets the person in charge recognize the issue and take follow-up action.
- Data cleansing shall be carried out with stakeholder consent. This matters when cleansing changes data that other teams rely on.
Process for sensor data cleansing
Clause 5 describes an offline process based on plan-do-check-act and modeled with IDEF0 (integration definition for function modelling). The process is split into three main activities.
- A1 - Prepare measurement plan - establish the data quality goal, perform data profiling, and develop a measurement plan. This links the cleansing work to real quality requirements instead of guesswork.
- A2 - Measure data quality - derive an anomaly detection model, identify quality improvement opportunity, and report the quality result. In practice, this tells you whether the data already meet requirements or whether repair is worth doing.
- A3 - Improve data quality - establish a data repair plan, confirm it with stakeholders, and execute data repair. This creates a controlled repair step rather than an ad hoc edit.
Clause 5 also makes clear that this process is for post-processing, not real time processing. That matters when choosing where the standard fits in a data pipeline.
Implementation requirements
Clause 6 gives the conditions for using the process.
- Sensor data shall be identifiable.
- Sensor data shall be obtained according to predefined data formats, so they are readily accessible and understandable.
- To understand and improve sensor data quality, an organization shall use the data quality characteristics and anomalies from ISO 8000-210.
- It shall also use the data quality measures from ISO 8000-220.
In practice, Clause 6 ties cleansing work to a stable data structure and to the quality model used elsewhere in the ISO 8000 sensor data parts.
Annex B methods
Annex B is informative, but it is the main technical reference for method selection. It groups anomaly detection and repair methods for time series sensor data into basic, statistical, digital signal processing, and machine learning categories. It also distinguishes point, collective, and contextual anomalies, and it maps methods to anomaly types such as spike, drift, shift, noise, stuck, and incorrect timestamp. This helps a team choose a method that matches the observed problem.
What terms does ISO/TS 8000-230:2026 define?
- sensor - A device that observes and measures a property and converts that measurement into a signal.
- sensor network - A system of spatially distributed sensor nodes that acquire, process, transfer, and provide information from the environment.
- sensor node - A sensor network element that includes at least one sensor and may also include actuators and communication or data processing capabilities.
- sensor data - Data produced by a sensor node, including digital values, sensor identification, and timestamps.
- data anomaly - An item of data that deviates from the expected pattern in a data set.
- data cleansing - The process used to improve data quality by detecting and repairing defects and errors in data.
- quality characteristic - An inherent characteristic of an object related to a requirement.
- data quality measure - A variable assigned a value as the result of measuring a data quality characteristic.
- internet of things (IoT) - An infrastructure of interconnected entities, people, systems, and information resources that processes and reacts to information from the physical and virtual world.
Who uses ISO/TS 8000-230:2026?
ISO/TS 8000-230:2026 is used by teams that work with sensor data in IoT and sensor network environments. That includes data quality managers, automation engineers, system integrators, asset operators, and analysts who need to decide whether sensor data are fit for analysis or exploitation.
It is also relevant to people who prepare measurement plans, profile historical data, choose anomaly detection methods, define repair plans, and confirm those plans with stakeholders. In practice, they use the document to make sensor data handling more consistent across systems and data flows.
Which standards are used with ISO/TS 8000-230:2026?
- ISO 8000-2 - Provides the vocabulary used by the document.
- ISO 8000-210 - Supplies the sensor data quality characteristics and anomaly definitions used in the process.
- ISO 8000-220 - Supplies the quality measures used to assess sensor data quality and improvement.
- ISO 8000-61 - Provides the data quality management process reference model and the plan-do-check-act context mentioned in Clause 5.
- ISO/TS 8000-81 - Supports data profiling, which is used in the measurement plan activity.
- ISO/IEC/IEEE 31320-1 - Provides the IDEF0 notation used for the functional model of the cleansing process.
- ISO/IEC 8824-1 - Defines the ASN.1 notation used in Annex A for document identification.
- ISO 10303-1 - Defines the meaning of the object identifier value assigned in Annex A.
What does the ISO/TS 8000-230:2026 document contain?
ISO/TS 8000-230:2026 contains a clause-based process description with diagrams, activity breakdowns, and role-oriented descriptions of inputs, outputs, controls, and mechanisms. The process model is shown as a context diagram and child diagrams for preparing the measurement plan, measuring data quality, and improving data quality.
Annex B contains a structured catalogue of detection and repair methods for sensor-data anomalies, including tables that relate methods to anomaly types. Annex C contains worked examples for tunnel boring machine sensor data, covering vibration acceleration, strain, and propulsion cylinder stroke data. Those examples show how to set a quality goal, measure quality, select a repair method, confirm the repair plan, and report the result.
Get Certified
Connect with accredited certification bodies for this standard

DVS-ZERT GmbH
German welding certification society.
CARES (UK Certification Authority for Reinforcing Steels)
UK certification for reinforcing steels and construction.
EWF/IIW (European/International Welding Federation)
International welding personnel certification.
Sponsored listings
Frequently Asked Questions
ISO/TS 8000-230:2026 is a technical specification published by the International Organization for Standardization (ISO). Its full title is "Data quality — Part 230: Sensor data — Guidelines for data cleansing". This standard covers: This document specifies guidelines to improve data quality by cleansing sensor data anomalies that affect low inherent quality characteristics. The following are within the scope of this document: principles for sensor data cleansing; the process for sensor data cleansing; implementation requirements for sensor data cleansing; list of data anomaly detection and repair methods (see Annex B); examples of sensor data cleansing (see Annex C). The following are outside the scope of this document: algorithms or detailed methods to detect and repair data anomalies; the process of sensor data cleansing for real time processing.
This document specifies guidelines to improve data quality by cleansing sensor data anomalies that affect low inherent quality characteristics. The following are within the scope of this document: principles for sensor data cleansing; the process for sensor data cleansing; implementation requirements for sensor data cleansing; list of data anomaly detection and repair methods (see Annex B); examples of sensor data cleansing (see Annex C). The following are outside the scope of this document: algorithms or detailed methods to detect and repair data anomalies; the process of sensor data cleansing for real time processing.
ISO/TS 8000-230:2026 is classified under the following ICS (International Classification for Standards) categories: 25.040.40 - Industrial process measurement and control. The ICS classification helps identify the subject area and facilitates finding related standards.
ISO/TS 8000-230:2026 is available in PDF format for immediate download after purchase. The document can be added to your cart and obtained through the secure checkout process. Digital delivery ensures instant access to the complete standard document.
Standards Content (Sample)
Technical
Specification
ISO/TS 8000-230
First edition
Data quality —
2026-05
Part 230:
Sensor data — Guidelines for data
cleansing
Qualité des donnés —
Partie 230: Données des capteurs — Lignes directrices relatives
au nettoyage des données
Reference number
© ISO 2026
All rights reserved. Unless otherwise specified, or required in the context of its implementation, no part of this publication may
be reproduced or utilized otherwise in any form or by any means, electronic or mechanical, including photocopying, or posting on
the internet or an intranet, without prior written permission. Permission can be requested from either ISO at the address below
or ISO’s member body in the country of the requester.
ISO copyright office
CP 401 • Ch. de Blandonnet 8
CH-1214 Vernier, Geneva
Phone: +41 22 749 01 11
Email: copyright@iso.org
Website: www.iso.org
Published in Switzerland
ii
Contents Page
Foreword .iv
Introduction .v
0.1 Foundations of the ISO 8000 series .v
0.2 Understanding more about the ISO 8000 series .vi
0.3 Role of this document .vi
0.4 Benefits of the ISO 8000 series . vii
1 Scope . 1
2 Normative references . 1
3 Terms and definitions . 1
3.1 Terms relating to sensor data .2
3.2 Terms relating to data quality .2
3.3 Terms relating to measurement .3
4 Principles for sensor data cleansing . . 3
5 Process for sensor data cleansing . 4
5.1 General .4
5.2 Functional model of sensor data cleansing .4
5.2.1 Perform sensor data cleansing (A0) .4
5.2.2 Prepare measurement plan (A1) .6
5.2.3 Measure data quality (A2) .8
5.2.4 Improve data quality (A3) .10
6 Implementation requirements .12
Annex A (informative) Document identification .13
Annex B (informative) Cleansing methods for data anomaly . 14
Annex C (informative) Examples for sensor data cleansing .24
Bibliography .39
iii
Foreword
ISO (the International Organization for Standardization) is a worldwide federation of national standards
bodies (ISO member bodies). The work of preparing International Standards is normally carried out through
ISO technical committees. Each member body interested in a subject for which a technical committee
has been established has the right to be represented on that committee. International organizations,
governmental and non-governmental, in liaison with ISO, also take part in the work. ISO collaborates closely
with the International Electrotechnical Commission (IEC) on all matters of electrotechnical standardization.
The procedures used to develop this document and those intended for its further maintenance are described
in the ISO/IEC Directives, Part 1. In particular, the different approval criteria needed for the different types
of ISO document should be noted. This document was drafted in accordance with the editorial rules of the
ISO/IEC Directives, Part 2 (see www.iso.org/directives).
ISO draws attention to the possibility that the implementation of this document may involve the use of (a)
patent(s). ISO takes no position concerning the evidence, validity or applicability of any claimed patent
rights in respect thereof. As of the date of publication of this document, ISO had not received notice of (a)
patent(s) which may be required to implement this document. However, implementers are cautioned that
this may not represent the latest information, which may be obtained from the patent database available at
www.iso.org/patents. ISO shall not be held responsible for identifying any or all such patent rights.
Any trade name used in this document is information given for the convenience of users and does not
constitute an endorsement.
For an explanation of the voluntary nature of standards, the meaning of ISO specific terms and expressions
related to conformity assessment, as well as information about ISO’s adherence to the World Trade
Organization (WTO) principles in the Technical Barriers to Trade (TBT), see www.iso.org/iso/foreword.html.
This document was prepared by Technical Committee ISO/TC 184, Automation systems and integration,
Subcommittee SC 4, Industrial data.
A list of all parts in the ISO 8000 series can be found on the ISO website.
Any feedback or questions on this document should be directed to the user’s national standards body. A
complete listing of these bodies can be found atwww.iso.org/members.html.
iv
Introduction
0.1 Foundations of the ISO 8000 series
Digital data deliver value by enhancing all aspects of organizational performance including:
— operational effectiveness and efficiency;
— safety and security;
— reputation with customers and the wider public;
— compliance with statutory regulations;
— innovation;
— consumer costs, revenues and stock prices.
In addition, many organizations are now addressing these considerations with reference to the United
1)
Nations Sustainable Development Goals .
The influence on performance originates from data being the formalized representation of information.
[1]
ISO 8000-2 defines information as “knowledge concerning objects, such as facts, events, things, processes,
or ideas, including concepts, that within a certain context has a particular meaning”. This information
enables organizations to make reliable decisions. This decision making can be performed by human beings
directly and also by automated data processing including artificial intelligence systems.
Through widespread adoption of digital computing and associated communication technologies,
organizations become dependent on digital data. This dependency amplifies the negative consequences of
lack of quality in these data. These consequences are the decrease of organizational performance.
The biggest impact of digital data comes from two key factors:
— the data having a structure that reflects the nature of the subject matter;
EXAMPLE 1 A research scientist writes a report using a software application for word processing. This report
includes a table that uses a clear, logical layout to show results from an experiment. These results indicate how
material properties vary with temperature. The report is read by a designer, who uses the results to create a product
that works in a range of different operating temperatures.
— the data being computer processable (machine readable) rather than just being for a person to read and
understand.
EXAMPLE 2 A research scientist uses a database system to store the results of experiments on a material. This
system controls the format of different values in the data set. The system generates an output file of digital data.
This file is processed by a software application for engineering analysis. The application determines the optimum
geometry when using the material to make a product.
[2]
ISO 9000 explains that quality is not an abstract concept of absolute perfection. Quality is actually the
conformance of characteristics to requirements. This actuality means that any item of data can be of high
quality for one purpose but not for a different purpose. The quality is different because the requirements are
different between the two purposes.
EXAMPLE 3 Time data are processed by calendar applications and also by control systems for propulsion units
on spacecraft. These data include start times for meetings in a calendar application and activation times in a control
system. These start times require less precision than the activation times.
1) https://sdgs.un.org/goals
v
The nature of digital data is fundamental to establishing requirements that are relevant to the specific
decisions made by each organization.
[3]
EXAMPLE 4 ISO 8000-1 identifies that data have syntactic (format), semantic (meaning) and pragmatic
(usefulness) characteristics.
To support the delivery of high-quality data, the ISO 8000 series addresses:
— data governance, data quality management and maturity assessment;
[4]
EXAMPLE 5 ISO 8000-61 specifies a process reference model for data quality management.
— creating and applying requirements for data and information;
[5]
EXAMPLE 6 ISO 8000-110 specifies how to exchange characteristic data that are master data.
— monitoring and measuring information and data quality;
[6]
EXAMPLE 7 ISO 8000-8 specifies approaches to measuring information and data quality.
— improving data and, consequently, information quality;
[7]
EXAMPLE 8 ISO/TS 8000-81 specifies an approach to data profiling, which identifies opportunities to improve
data quality.
— issues that are specific to the type of content in a data set.
[8]
EXAMPLE 9 ISO/TS 8000-311 specifies how to address quality considerations for product shape data.
Data quality management covers all aspects of data processing, including creating, collecting, storing,
maintaining, transferring, exploiting and presenting data to deliver information.
Effective data quality management is systemic and systematic, requiring an understanding of the root causes
of data quality issues. This understanding is the basis for not just correcting existing nonconformities but
for also implementing solutions that prevent future reoccurrence of those nonconformities.
EXAMPLE 10 If a data set includes dates in multiple formats including “yyyy-mm-dd”, “mm-dd-yy” and “dd-mm-yy”,
then data cleansing can correct the consistency of the values. Such cleansing requires additional information, however,
to resolve ambiguous entries (such as “04-05-20”). The cleansing also cannot address any process issues and people
issues, including training, that have caused the inconsistency.
0.2 Understanding more about the ISO 8000 series
[3]
ISO 8000-1 provides a detailed explanation of the structure and scope of the ISO 8000 series.
[1]
ISO 8000-2 specifies the single, common vocabulary for the ISO 8000 series. This vocabulary is ideal
[1]
reading material by which to understand the overall subject matter of data quality. ISO 8000-2 presents
the vocabulary structured by a series of topic areas (e.g. terms relating to quality and terms relating to data
and information).
[3] [1] [6]
ISO has identified ISO 8000-1 , ISO 8000-2 and ISO 8000-8 as horizontal deliverables, i.e. deliverable
dealing with a subject relevant to a number of committees or sectors or of crucial importance to ensure
coherence across standardization deliverables.
0.3 Role of this document
As a contribution to the overall capability of the ISO 8000 series, this document addresses guidelines to
improve the quality of sensor data by cleansing data anomalies that affect low quality characteristics. The
guidelines include principles, the process and implementation requirements for sensor data cleansing.
The process performs sensor data cleansing using data quality characteristics and anomalies defined in
[9] [10]
ISO 8000-210 and data quality measures defined in ISO 8000-220 . To help users understand, they
also present methods and examples of cleansing data anomalies. Through this document, users will learn
vi
procedures and methods for improving the quality of sensor data collected from IoT or sensor network
environments prior to data analysis and exploitation.
This document supports activities that affect:
— one or more information systems;
— data flows within the organization and with external organizations;
— any phase of the data life cycle.
Organizations can use this document on its own or in conjunction with other parts in the ISO 8000 series.
[11]
Annex A contains an identifier that conforms to ISO/IEC 8824-1 . The identifier unambiguously identifies
this document in an open information system.
0.4 Benefits of the ISO 8000 series
By implementing parts of the ISO 8000 series to improve organizational performance, an organization
achieves the following benefits:
— objective validation of the foundations for digital transformation of the organization;
— a sustainable basis for data in digital form becoming a fundamental asset class the organization relies on
to deliver value;
— securing evidence-based trust from other parties (including supply chain partners and regulators) about
the repeatability and reliability of data and information processing in the organization;
— portability of data with resulting protection against loss of intellectual property and re-usability across
the organization and applications;
— effective and efficient interoperability between all parties in a supply chain to achieve traceability of
data back to original sources;
— readiness to acquire or supply services where the other party expects to work with common understanding
of explicit data requirements.
vii
Technical Specification ISO/TS 8000-230:2026(en)
Data quality —
Part 230:
Sensor data — Guidelines for data cleansing
1 Scope
This document specifies guidelines to improve data quality by cleansing sensor data anomalies that affect
low inherent quality characteristics.
The following are within the scope of this document:
— principles for sensor data cleansing;
— the process for sensor data cleansing;
— implementation requirements for sensor data cleansing;
— list of data anomaly detection and repair methods (see Annex B);
— examples of sensor data cleansing (see Annex C).
The following are outside the scope of this document:
— algorithms or detailed methods to detect and repair data anomalies;
— the process of sensor data cleansing for real time processing.
2 Normative references
The following documents are referred to in the text in such a way that some or all of their content constitutes
requirements of this document. For dated references, only the edition cited applies. For undated references,
the latest edition of the referenced document (including any amendments) applies.
ISO 8000-2, Data quality — Part 2: Vocabulary
ISO 8000-210, Data quality – Part 210: Sensor data: Data quality characteristics
ISO 8000-220, Data quality – Part 220: Sensor data: Quality measurement
3 Terms and definitions
For the purposes of this document, the terms and definitions given in ISO 8000-2 and the following apply.
ISO and IEC maintain terminology databases for use in standardization at the following addresses:
— ISO Online browsing platform: available at https:// www .iso .org/ obp
— IEC Electropedia: available at https:// www .electropedia .org/
3.1 Terms relating to sensor data
3.1.1
sensor
device that observes and measures a property of a natural phenomenon, system or human-made process
and converts that measurement into a signal
Note 1 to entry: A sensor can exist not only in a single physical form but also in a sensor-based variant such as a virtual
sensor.
[12]
[SOURCE: ISO/IEC 29182-2:2013 , 2.1.5, modified — “system” has been added to the definition, “man”
changed to “human”, and “physical” deleted from the definition. Note 1 to entry has been changed.]
3.1.2
sensor network
system of spatially distributed sensor (3.1.1) nodes interacting with each other and, depending on
applications, possibly with other infrastructure in order to acquire, process, transfer, and provide
information extracted from its environment with a primary function of information gathering and possible
control capability
Note 1 to entry: Distinguishing features of a sensor network can include wide area coverage, use of radio networks,
flexibility of purpose, self-organization, openness, and providing data for multiple applications.
[12]
[SOURCE: ISO/IEC 29182-2:2013 , 2.1.6]
3.1.3
sensor node
sensor network (3.1.2) element that includes at least one sensor (3.1.1) and, optionally actuators with
communication capabilities and data processing capabilities
Note 1 to entry: It can include additional application capabilities.
Note 2 to entry: A hybrid sensor composed of multiple sensors is considered a sensor node that includes multiple
sensors.
[12]
[SOURCE: ISO/IEC 29182-2:2013 , 2.1.8, modified — Note 2 to entry has been added to the definition.]
3.1.4
sensor data
data produced by a sensor node (3.1.3)
Note 1 to entry: Sensor data consist of a stream of digital values converted from sensor (3.1.1) signals, and information
such as the identification of each sensor and timestamps of data acquired by the sensor node.
3.1.5
internet of things
IoT
infrastructure of interconnected entities, people, systems and information resources together with services
which processes and reacts to information from the physical world and virtual world
[13]
[SOURCE: ISO/IEC 20924:2024 , 3.2.4]
3.2 Terms relating to data quality
3.2.1
data anomaly
item of data in a data set, where the item deviates from the expected pattern for items in the data set
3.2.2
quality characteristic
inherent characteristic of an object related to a requirement
[6]
Note 1 to entry: ISO 8000-8 uses the term quality dimension as a synonym for quality characteristics that determine
the pragmatic quality of data.
[14]
[SOURCE: ISO 9000:2015 , 3.10.2, modified — Note 1 to entry has been added.]
3.2.3
data cleansing
process used to improve data quality by detecting and repairing defects and errors in data
[1]
Note 1 to entry: In ISO 8000-2 , data error is defined as non-fulfilment of a data requirement and also noted as
synonymous with data nonconformity.
[2]
Note 2 to entry: In ISO 9000 , defect is defined as non-fulfilment of a requirement related to an intended or specified
use.
[4]
Note 3 to entry: In ISO 8000-61 , data cleansing is specified as a sub-process of data quality improvement.
[15]
[SOURCE: ISO 13008:2022 , 3.4, modified — “correcting (or removing)" is changed to “repairing” and
Notes 1, 2 and 3 to entry are added.]
3.2.4
data profiling
activities that are performed to understand the data structures and system rules that affect the extraction
of audit data
[16]
[SOURCE: ISO 21378:2019 , 3.6]
3.3 Terms relating to measurement
3.3.1
data quality measure
quality measure
variable to which a value is assigned as the result of measuring a data quality characteristic (3.2.2)
[17]
Note 1 to entry: Adapted from ISO/IEC 25012:2008 , 4.5.
4 Principles for sensor data cleansing
— When a data anomaly occurs due to sensor or system errors, the quality of the data shall be improved by
deleting or modifying the anomalous data.
— When a data anomaly reflects actual phenomena in the field, whether to maintain, delete, or modify the
anomalous data shall be decided according to the stated purpose of an intended or specified use.
— When the cause of data anomaly is not clearly identified, data deletion or modification shall be minimized
to avoid changing the original correct data.
— When a data anomaly cannot be deleted or modified for any reason, a flag or mark shall be placed on the
data so that the person in charge of the data can recognize it and take appropriate actions.
— Data cleansing shall be carried out with the consent of stakeholders.
5 Process for sensor data cleansing
5.1 General
The sensor data cleansing process is designed with the following considerations in mind:
— The plan-do-check-act concept used to define the data quality management process in ISO 8000-61
[4]
is applied to the data cleansing process. In other words, the process is designed with the following
activities: provide a quality measurement plan (plan), measure data quality (do and check) and improve
data quality (act). In addition, once the plan is provided, activities of measurement (do and check) and
improvement (act) are repeatedly performed to determine whether the sensor data satisfy quality
requirements.
— This process is designed for post processing (or offline mode), not for real time processing (or online
mode).
NOTE 1 As sensor data are collected in the form of streams in real time and the amount is very large, it takes
time to cleanse them. Therefore, real-time data cleansing is not realistic in the environment for rapid decision-
making. Real-time data cleansing can only be performed in special environments where data anomalies are
already known and do not need checked or verified.
— The process is represented by the IDEF0 (integration definition for function modelling) functional model
[18]
defined by ISO/IEC/IEEE 31320-1 . This model breaks down a process into hierarchical activities to
show what activities are performed and how. It helps analyse and design processes by clearly showing
the inputs, outputs, controls, and mechanisms of each activity.
NOTE 2 A functional model is identified by a model name, an IDEF0 box is identified by a box name, and an
IDEF0 arrow segment is identified by an arrow label. An identifier is written in title case, i.e. the first letter of
[18]
each word is capitalized. See ISO/IEC/IEEE 31320-1 for details on the notation in the functional model.
5.2 Functional model of sensor data cleansing
5.2.1 Perform sensor data cleansing (A0)
The functional model of the sensor data cleansing process is represented by the A-0 context diagram for
perform sensor data cleansing (see Figure 1).
Figure 1 — A-0 context diagram for perform sensor data cleansing (model diagram A0)
This process is to perform data cleansing to improve the quality of sensor data prior to data analysis or
exploitation. By accepting sensor data and considering quality requirements, quality characteristics defined
[19] [20]
in ISO 8000-210 , and quality measures defined in ISO 8000-220 , the process provides sensor data
with a quality report as an output.
Figure 2 — Perform sensor data cleansing (model diagram A0)
As in Figure 2, this process consists of three activities, prepare measurement plans (A1), measure data
quality (A2) and improve data quality (A3).
NOTE 1 Figure 2 is a child diagram of Figure 1.
Each activity at the lowest level of the process is described by the following elements:
[21]
— a title, which is a descriptive heading for an activity (modified from ISO/IEC TR 24774:2010 );
— a purpose, which describes the goal of performing an activity (modified from ISO/IEC TR 24774:2010
[21]
);
— tasks, which are required, recommended, or permissible actions, intended to contribute to the
[22]
achievement of the goal of an activity (modified from ISO/IEC/IEEE 24774:2021 );
— inputs, which are items transformed into output by an activity (modified from ISO/IEC/IEEE 31320-1
[18]
);
— outputs, which are product, result or service produced by an activity (modified from
[22]
ISO/IEC/IEEE 24774:2021 );
— controls, which are conditions or constraints required for an activity to produce correct output (modified
[18]
from ISO/IEC/IEEE 31320-1 );
— mechanisms, which are the means used by an activity to transform input into output (modified from
[18]
ISO/IEC/IEEE 31320-1 ).
[21]
NOTE 2 These elements are adapted from those of process description in ISO/IEC TR 24774:2010 ,
[22] [18]
ISO/IEC/IEEE 24774:2021 and those of functional model in ISO/IEC/IEEE 31320-1 to fit the activity definition.
5.2.2 Prepare measurement plan (A1)
5.2.2.1 General
This activity is intended to prepare a plan for measuring sensor data quality based on quality requirements,
quality characteristics, quality measures and sensor data.
Measurement
plan
Figure 3 — Prepare measurement plan (model diagram A1)
As in Figure 3, this activity consists of three sub-activities, establish data quality goal (A11), perform data
profiling (A12) and develop measurement plan (A13).
5.2.2.2 Establish data quality goal (A11)
Purpose: Establish data quality goal is to determine the data quality-related goals that reflect quality
requirements of sensor data.
Task:
— gather data quality requirements from stakeholders;
— determine the goal to achieve based on data quality requirements.
Input: Sensor data collected from sensor nodes.
Output: Data quality goal represented by data quality requirements such as quality measure levels of quality
characteristics in interest.
Control: Quality requirements, quality characteristics and corresponding data anomalies defined in
ISO 8000-210, and quality measures defined in ISO 8000-220.
Mechanism: Software/Human
5.2.2.3 Perform data profiling (A12)
Purpose: Perform data profiling to acquire historical sensor data and perform their data profiling. Through
this activity, the profile and data quality issues of sensor data are extracted from a cluster of historical
occurrences of the relevant sensor data.
Task:
— collect historical sensor data;
— perform data profiling for the sensor data.
[7]
NOTE Refer to ISO/TS 8000-81 for data profiling.
Input: Historical sensor data
Output: Data profile with quality issues
Control: Data quality goal
Mechanism: Software that provides statistical, mathematical, or data learning techniques, or human that
inputs information interactively or manually.
5.2.2.4 Develop measurement plan (A13)
Purpose: Develop measurement plan is to establish the measurement plan that includes the methods,
procedures, criteria, and rationale that will be used to measure the quality of sensor data in accordance
with the reference data patterns.
Task:
— define methods and procedures to measure data quality;
— determine criteria and information necessary to assess data quality.
Input: None
Output: Measurement plan
Control: Data quality goal, data profile with quality issues, and quality measures defined in ISO ISO 8000-220
Mechanism: Software/Human
5.2.3 Measure data quality (A2)
5.2.3.1 General
This activity is intended to derive an anomaly detection model and quality measure values of sensor data
based on the established measurement plan and identifies opportunities for quality improvement.
Figure 4 — Measure data quality (model diagram A2)
As in Figure 4, this activity consists of three sub-activities, derive anomaly detection model (A21), find
quality improvement opportunity (A22), and report quality result (A23).
5.2.3.2 Derive anomaly detection model (A21)
Purpose: Derive anomaly detection model is to analyse data patterns in sensor data and determine a model
that can detect data anomalies.
Task:
— analyse data patterns;
— determine an anomaly detection model.
NOTE Refer to Clause B.1 for anomaly detection models, which have functions that identify the type of anomaly or
detect anomalous data values included in sensor data.
Input: Sensor data
Output: Anomaly detection model
Control: Measurement plan
5.2.3.3 Find quality improvement opportunity (A22)
Purpose: Find quality improvement opportunity is to assess quality measures based on the anomaly
detection model and find opportunities that the quality of sensor data can be improved by modifying data
anomalies.
Task:
— Assess quality characteristic-specific quality measures: Measure quality characteristic-specific quality
measures defined in ISO 8000-220. If they satisfy quality requirements, the task stops since the sensor
data do not require quality improvement. Otherwise, the following additional task is carried out for data
anomalies that affect data quality.
— Assess anomaly-specific quality measures: Detect data anomalies included in sensor data, and measure
anomaly-specific quality measures defined in ISO 8000-220. If there exists any data anomaly modifiable
to improve quality characteristic-specific quality measures (or to reduce anomaly-specific quality
measures), the sensor data are those with quality improvement opportunity. Otherwise, the sensor data
are those without quality improvement opportunity.
Input: Sensor data
Output:
— sensor data with quality improvement opportunity that identifies data anomalies modifiable to improve
the quality of sensor data;
— sensor data without quality improvement opportunity that do not require quality improvement because
they meet quality requirements, or that cannot be improved because no data anomaly to improve the
quality of sensor data is identified.
Control: Anomaly detection model, measurement plan, quality characteristics and quality measures defined
in ISO 8000-220.
Mechanism: Software/Human
5.2.3.4 Report quality result (A23)
Purpose: Report quality result is to report the quality result of sensor data.
Task:
— gather quality information including quality requirements, problems, and improvements;
— write up the report that reflects quality improvement efforts.
Input: Sensor data without quality improvement opportunity that do not require quality improvement
because they meet quality requirements, or that cannot be improved because no data anomaly to improve is
identified.
Output: Sensor data with quality report that includes quality information such as quality requirements,
improvements by cleansing, and problems. The sensor data fall into one of two categories:
a) the sensor data that meet quality requirements and are usable for data analysis or exploitation;
b) the sensor data that do not meet quality requirements, whose quality can no longer be improved,
and therefore are not usable for data analysis or exploitation. In this case, the sensor data are either
discarded or subjected to more in-depth cause analysis for poor data quality.
Control: None
Mechanism: Software/Human
5.2.4 Improve data quality (A3)
5.2.4.1 General
This activity is intended to improve data quality by cleansing sensor data based on the identified data
quality improvement opportunity and provide cleansed sensor data.
Figure 5 — Improve data quality (model diagram A3)
As in Figure 5, this activity consists of three sub-activities, establish data repair plan, confirm data repair
plan, and execute data repair.
5.2.4.2 Establish data repair plan (A31)
Purpose: Establish data repair plan is to establish a specific action plan to cleanse sensor data based on the
identified quality improvement opportunity.
Task:
— list alternative methods for repairing data anomalies;
— determine data repair plans.
Input: Sensor data with quality improvement opportunity
Output: Data repair plan
Control: None
Mechanism: Software/Human
5.2.4.3 Confirm data repair plan (A32)
Purpose: Confirm data repair plan is to obtain confirmation from various stakeholders on the established
data repair plan and finalize it. This is an effort to ensure that stakeholders are fully informed and agree on
the risks and issues that may arise from data repair.
Task:
— collect stakeholders’ opinions on data repair plans;
— confirm the implementable data repair plan including data repair priorities.
Input: Data repair plan
Output: Confirmed data repair plan
Control: None
Mechanism: Software/Human
5.2.4.4 Execute data repair (A33)
Purpose: Execute data repair is to put the data repair plan into concrete action and provide cleansed sensor
data.
Task:
— refine the implementation plan for data repair;
— execute data repair and result checking.
NOTE Refer to Clause B.2 for methods on how to execute data repair.
Input: Sensor data with quality improvement opportunity
Output: Cleansed sensor data with indication that they have been cleansed
Control: Confirmed data repair plan
Mechanism: Software/Human which includes methods for repairing data anomalies.
6 Implementation requirements
In order to perform cleansing of sensor data, the following requirements shall be met:
— sensor data are identifiable;
— sensor data are obtained according to data formats predefined for data acquisition, and therefore, readily
accessible and understandable.
When wishing to understand and potentially improve the quality of sensor data, an organization shall
perform data cleansing using:
— the data quality characteristics and anomalies specified by ISO 8000-210;
— the data quality measures specified by ISO 8000-220.
Annex A
(informative)
Document identification
To provide for unambiguous identification of an information object in an open system, the following object
identifier is assigned to this document: { iso standard 8000 part(230) version(1) }
[23]
The meaning of this value is defined in ISO 10303-1 .
Annex B
(informative)
Cleansing methods for data anomaly
B.1 Detection of data anomalies
B.1.1 Data anomaly and detection cases
Data anomaly can be classified into three cases:
— Point anomaly: If an individual data instance can be considered as anomalous with respect to the rest of
data, then the instance is termed as a point anomaly.
— Collective anomaly: If a collection of related data instances is anomalous with respect to the entire data
set or pattern, it is termed as a collective anomaly.
— Contextual anomaly: If a data instance is anomalous in a specific context (but not otherwise), then it is
termed as a contextual anomaly (also referred to as conditional anomaly).
Anomaly detection approaches are based on models and predictions from past historical data. When an
anomaly detection algorithm is applied, three possible cases can be considered:
— Correct detection: Detected data anomalies do correspond exactly to abnormalities that happened in the
real field.
— False positives: The real field continues to be normal, but unexpected anomalous data values are
observed, e.g. due to system failure and malfunction.
— False negatives: The real field becomes abnormal, but the result does not appear as data anomalies.
In this document, correct detection and false positives will be considered since data cleansing is possible
only when data anomalies are detected in the retained sensor data.
B.1.2 Anomaly detection for time series
B.1.2.1 General
Time series is a totally ordered sequence of data items (numerical values), each associated with a timestamp
which makes it possible to identify the time gap between any two items. Therefore, sensor data as a stream
of single, discrete digital values are a type of time series.
There are many anomaly detection methods for time series, among which 21 well-known ones are presented
and grouped into four categories: basic, statistical, digital signal processing, and machine learning.
NOTE These anomaly detection methods are intended to detect anomalous data values or patterns as outliers,
but not to identify the type of data anomaly.
B.1.2.2 Basic method type
This includes several different methods such as fixed threshold and dynamic threshold. The individual
methods are described below:
— Fixed threshold: a technique which employs predetermined static values, known as thresholds, to
identify anomalies. A lower limit and/or an upper limit is set as a threshold based on domain knowledge,
historical data analysis, or other relevant criteria. When a new data point in the time series is measured,
it is compared against this fixed threshold. If the measured value exceeds the upper threshold or falls
below the lower threshold, it is flagged as an anomaly.
— Dynamic threshold: a method which uses a dynamic threshold to identify anomalies. If a data point is
greater than or less than the threshold, it is considered an anomaly. The threshold is adjusted adaptively
based on the statistical properties of the signal (such as mean and variance) and the levels of possible
[24]
background noise in the current or recent period of time .
— Time interval analysis: an approach used to identify anomalies in time-stamped data sets by examining
the intervals between consecutive timestamps. It calculates the differences in time between adjacent
timestamps and compares these intervals against a predefined threshold. Intervals that fall outside the
threshold are flagged as anomalies, indicating possible incorrect timestamps or data loss.
— Sequential dependency check: a method used to verify the correctness of timestamps by ensuring that
the timestamps match the chronological and logical sequence of events. It analyses the chronological
order of timestamps and the logical sequence of associated events to identify missing, extraneous, or
out-of-order data.
— Sliding window: a fundamental method which involves defining a window or range in the input data and
then moving that window across the data to perform some operation within the window. It shifts a
sliding window one by one element to the right until the end of data set. For each window, it computes
mean and standard deviation and compares the data point against a threshold, for example, . The
data point greater or less the threshold is considered an anomaly.
B.1.2.3 Statistical method type
This includes several different methods such as principal component analysis and inter-quartile range. The
individual methods are described below:
— Principal component analysis: one of the linear dimensionality reduction techniques which transforms
a data set into a new set of features called principal components. By using dimensionality reduction
technique, the main components are extracted from the source data, and then the original data are
reconstructed using only a few of these main components. The reconstructed data items with large
[25]
reconstruction errors are considered to be anomalies .
— Inter-quartile range: a statistical technique which employs inter-quartile range (IQR) to detect anomalies.
The IQR is a measure of statistical dispersion, which refers to the spread of the data, and is defined as
the difference between the 75th and 25th percentiles of the data. The 25th percentile is also known as
the first quartile (Q1) and the 75th percentile as the third quartile (Q3). To calculate the IQR, the data set
is divided into quartiles which divide the number of data points into four parts, or quarters, of more-or-
less equal size. A measured value is detected as an anomaly if it is less than Q1 minus 1.5 times the IQR
[26]
or greater than Q3 plus 1.5 times the IQR .
— Local outlier factor: an unsupervised anomaly detection technique that identifies anomalies based on
the local density of a given data point relative to its neighbours. Local density is typically defined as
the inverse of the average distance from the data point to its k-nearest neighbours. The local outlier
factor (LOF) score of a data point is calculated by comparing the local density of the point with the local
densities of its neighbours. A data point is considered an anomaly if its LOF score is significantly higher
[27]
than 1, indicating that it has a substantially lower local density compared to its neighbours .
— Anomaly if its z-score exceeds the threshold. Commonly, a z-score greater than 3 or less than -3 is used
as a threshold, indicating that the data point is more than three standard deviations away from the
[28]
mean .
— Technique which employs a specific decomposition method that separates a time series into its trend,
seasonal, and residual compone
...