


ASTM E1970-16(2021)
(Practice)Standard Practice for Statistical Treatment of Thermoanalytical Data
Standard Practice for Statistical Treatment of Thermoanalytical Data
SIGNIFICANCE AND USE
5.1 The standard deviation, or one of its derivatives, such as relative standard deviation or pooled standard deviation, derived from this practice, provides an estimate of precision in a measured value. Such results are ordinarily expressed as the mean value ± the standard deviation, that is, X ± s.
5.2 If the measured values are, in the statistical sense, “normally” distributed about their mean, then the meaning of the standard deviation is that there is a 67 % chance, that is 2 in 3, that a given value will lie within the range of ± one standard deviation of the mean value. Similarly, there is a 95 % chance, that is 19 in 20, that a given value will lie within the range of ± two standard deviations of the mean. The two standard deviation range is sometimes used as a test for outlying measurements.
5.3 The calculation of precision in the slope and intercept of a line, derived from experimental data, commonly is required in the determination of kinetic parameters, vapor pressure or enthalpy of vaporization. This practice describes how to obtain these and other statistically derived values associated with measurements by thermal analysis.
SCOPE
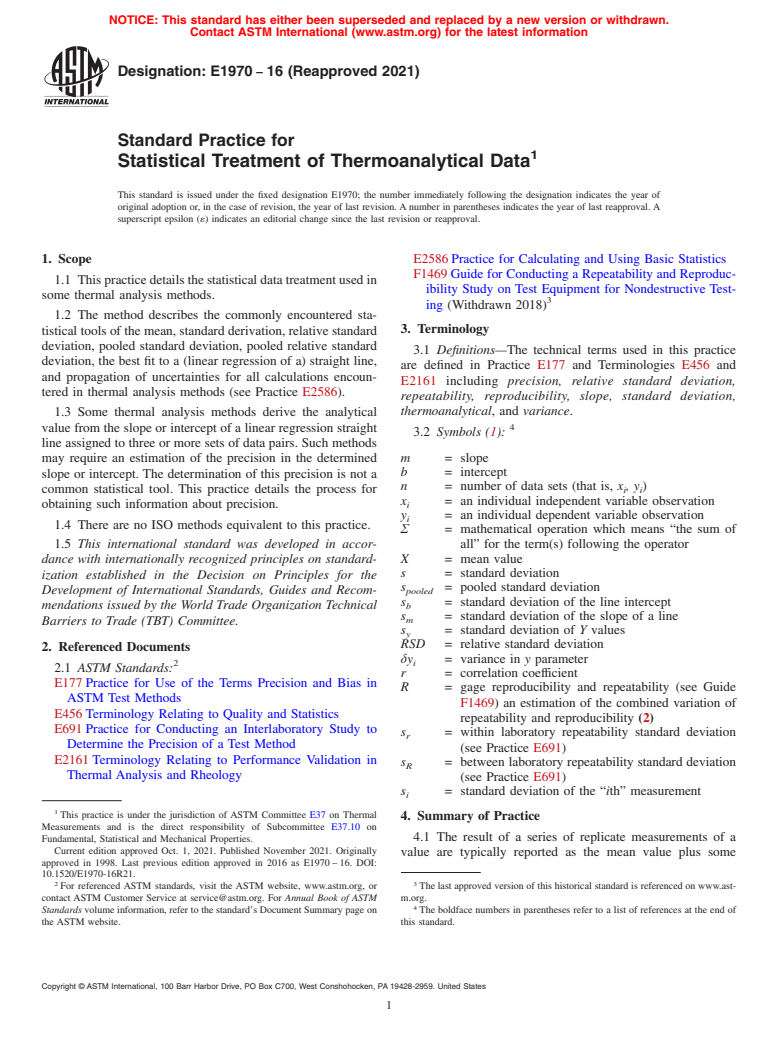
1.1 This practice details the statistical data treatment used in some thermal analysis methods.
1.2 The method describes the commonly encountered statistical tools of the mean, standard derivation, relative standard deviation, pooled standard deviation, pooled relative standard deviation, the best fit to a (linear regression of a) straight line, and propagation of uncertainties for all calculations encountered in thermal analysis methods (see Practice E2586).
1.3 Some thermal analysis methods derive the analytical value from the slope or intercept of a linear regression straight line assigned to three or more sets of data pairs. Such methods may require an estimation of the precision in the determined slope or intercept. The determination of this precision is not a common statistical tool. This practice details the process for obtaining such information about precision.
1.4 There are no ISO methods equivalent to this practice.
1.5 This international standard was developed in accordance with internationally recognized principles on standardization established in the Decision on Principles for the Development of International Standards, Guides and Recommendations issued by the World Trade Organization Technical Barriers to Trade (TBT) Committee.
General Information
Buy Standard
Standards Content (Sample)
NOTICE: This standard has either been superseded and replaced by a new version or withdrawn.
Contact ASTM International (www.astm.org) for the latest information
Designation: E1970 − 16 (Reapproved 2021)
Standard Practice for
Statistical Treatment of Thermoanalytical Data
This standard is issued under the fixed designation E1970; the number immediately following the designation indicates the year of
original adoption or, in the case of revision, the year of last revision. A number in parentheses indicates the year of last reapproval. A
superscript epsilon (´) indicates an editorial change since the last revision or reapproval.
1. Scope E2586 Practice for Calculating and Using Basic Statistics
F1469 Guide for Conducting a Repeatability and Reproduc-
1.1 This practice details the statistical data treatment used in
ibility Study on Test Equipment for Nondestructive Test-
some thermal analysis methods.
ing (Withdrawn 2018)
1.2 The method describes the commonly encountered sta-
3. Terminology
tistical tools of the mean, standard derivation, relative standard
deviation, pooled standard deviation, pooled relative standard
3.1 Definitions—The technical terms used in this practice
deviation, the best fit to a (linear regression of a) straight line,
are defined in Practice E177 and Terminologies E456 and
and propagation of uncertainties for all calculations encoun-
E2161 including precision, relative standard deviation,
tered in thermal analysis methods (see Practice E2586).
repeatability, reproducibility, slope, standard deviation,
thermoanalytical, and variance.
1.3 Some thermal analysis methods derive the analytical
value from the slope or intercept of a linear regression straight
3.2 Symbols (1):
line assigned to three or more sets of data pairs. Such methods
may require an estimation of the precision in the determined m = slope
b = intercept
slope or intercept. The determination of this precision is not a
n = number of data sets (that is, x , y )
common statistical tool. This practice details the process for i i
x = an individual independent variable observation
i
obtaining such information about precision.
y = an individual dependent variable observation
i
1.4 There are no ISO methods equivalent to this practice.
Σ = mathematical operation which means “the sum of
1.5 This international standard was developed in accor- all” for the term(s) following the operator
dance with internationally recognized principles on standard- X = mean value
s = standard deviation
ization established in the Decision on Principles for the
s = pooled standard deviation
Development of International Standards, Guides and Recom- pooled
s = standard deviation of the line intercept
mendations issued by the World Trade Organization Technical b
s = standard deviation of the slope of a line
m
Barriers to Trade (TBT) Committee.
s = standard deviation of Y values
y
RSD = relative standard deviation
2. Referenced Documents
δy = variance in y parameter
2 i
2.1 ASTM Standards:
r = correlation coefficient
E177 Practice for Use of the Terms Precision and Bias in
R = gage reproducibility and repeatability (see Guide
ASTM Test Methods
F1469) an estimation of the combined variation of
E456 Terminology Relating to Quality and Statistics
repeatability and reproducibility (2)
E691 Practice for Conducting an Interlaboratory Study to
s = within laboratory repeatability standard deviation
r
Determine the Precision of a Test Method
(see Practice E691)
E2161 Terminology Relating to Performance Validation in
s = between laboratory repeatability standard deviation
R
Thermal Analysis and Rheology
(see Practice E691)
s = standard deviation of the “ith” measurement
i
This practice is under the jurisdiction of ASTM Committee E37 on Thermal
4. Summary of Practice
Measurements and is the direct responsibility of Subcommittee E37.10 on
4.1 The result of a series of replicate measurements of a
Fundamental, Statistical and Mechanical Properties.
Current edition approved Oct. 1, 2021. Published November 2021. Originally
value are typically reported as the mean value plus some
approved in 1998. Last previous edition approved in 2016 as E1970 – 16. DOI:
10.1520/E1970-16R21.
2 3
For referenced ASTM standards, visit the ASTM website, www.astm.org, or The last approved version of this historical standard is referenced on www.ast-
contact ASTM Customer Service at service@astm.org. For Annual Book of ASTM m.org.
Standards volume information, refer to the standard’s Document Summary page on The boldface numbers in parentheses refer to a list of references at the end of
the ASTM website. this standard.
Copyright © ASTM International, 100 Barr Harbor Drive, PO Box C700, West Conshohocken, PA 19428-2959. United States
E1970 − 16 (2021)
estimation of the precision in the mean value. The standard the standard deviation is that there is a 67 % chance, that is 2
deviation is the most commonly encountered tool for estimat- in 3, that a given value will lie within the range of 6 one
ing precision, but other tools, such as relative standard devia- standard deviation of the mean value. Similarly, there is a 95 %
tion or pooled standard deviation, also may be encountered in chance, that is 19 in 20, that a given value will lie within the
specific thermoanalytical test methods. This practice describes range of 6 two standard deviations of the mean. The two
the mathematical process of achieving mean value, standard standard deviation range is sometimes used as a test for
deviation, relative standard deviation and pooled standard outlying measurements.
deviation.
5.3 The calculation of precision in the slope and intercept of
4.2 In some thermal analysis experiments, a linear or a
a line, derived from experimental data, commonly is required
straight line, response is assumed and desired values are
in the determination of kinetic parameters, vapor pressure or
obtained from the slope or intercept of the straight line through
enthalpy of vaporization. This practice describes how to obtain
the experimental data. In any practical experiment, however,
these and other statistically derived values associated with
there will be some uncertainty in the data so that results are
measurements by thermal analysis.
scattered about such a straight line. The linear regression (also
known as “least squares”) method is an objective tool for
6. Calculation
determining the “best fit” straight line drawn through a set of
6.1 Commonly encountered statistical results in thermal
experimental results and for obtaining information concerning
analysis are obtained in the following manner.
the precision of determined values.
4.2.1 For the purposes of this practice, it is assumed that the
NOTE 2—In the calculation of intermediate or final results, all available
figures shall be retained with any rounding to take place only at the
physical behavior, which the experimental results approximate,
expression of the final results according to specific instructions or to be
are linear with respect to the controlled value, and may be
consistent with the precision and bias statement.
represented by the algebraic function:
6.1.1 The mean value (X) is given by:
y 5 mx1b (1)
x 1x 1x 1. . . .1x Σx
1 2 3 i i
4.2.2 Experimental results are gathered in pairs, that is, for X 5 5 (2)
n n
every corresponding x (controlled) value, there is a corre-
i
sponding y (response) value.
6.1.2 The standard deviation (s) is given by:
i
4.2.3 The best fit (linear regression) approach assumes that
2 1/2
Σ~x 2 X!
i
s 5 (3)
all x values are exact and the y values (only) are subject to F G
i i
n 2 1
~ !
uncertainty.
6.1.3 The relative standard deviation (RSD) is given by:
NOTE 1—In experimental practice, both x and y values are subject to
uncertainty. If the uncertainty in x and y are of the same relative order of
RSD5 ~s·100%!/X (4)
i i
magnitude, other more elaborate fitting methods should be considered. For
many sets of data, however, the results obtained by use of the assumption 6.1.4 The pooled standard deviation (s ) is given by:
p
of exact values for the x data constitute such a close approximation to
i 1/2
Σ~$n 2 1%·s !
i i
those obtained by the more elaborate methods that the extra work and
5 (5)
F G
Σ~n 2 1!
additional complexity of the latter is hardly justified (2 and 3). i
NOTE 3—For the calculation of pooled relative standard deviation, the
4.2.4 The best fit approach seeks a straight line, which
values of s are replaced by RSD .
i i
minimizes the uncertainty in the y value.
i
6.1.5 The gage repeatability and reproducibility (R) is given
4.3 The law of propagation of uncertainties is a tool for
by:
estimating the precision in a determined value from the sum of
2 2 1/2
R 5 s 1s (6)
@ #
R r
the variance of the respective measurements from which that
NOTE 4—For the calculation of relative gage repeatability and
value is derived weighted by the square of their respective
reproducibility, the values of s and s are replaced with RSD and RSD .
r R r R
sensitivity coefficients.
6.2 Linear Regression (Best) Fit Straight Line:
4.3.1 Variance is the square of the standard deviation(s).
6.2.1 The slope (m) is given by:
Conversely the standard deviation is the positive square root of
the variance.
nΣ x y 2 Σx Σy
~ ! ~ ! ~ !
i i i i
m 5 (7)
4.3.2 The sensitivity coefficient is the partial derivative of 2 2
nΣx 2 Σx
~ !
i i
the function with respect to the individual variable.
6.2.2 The intercept (b) is given by:
5. Significance and Use
Σx Σy 2 Σx Σx y
~ ! ~ ! ~ ! ~ !
i i i i i
b 5 (8)
2 2
nΣx 2 Σx
~ !
5.1 The standard deviation, or one of its derivatives, such as i i
relative standard deviation or pooled standard deviation, de-
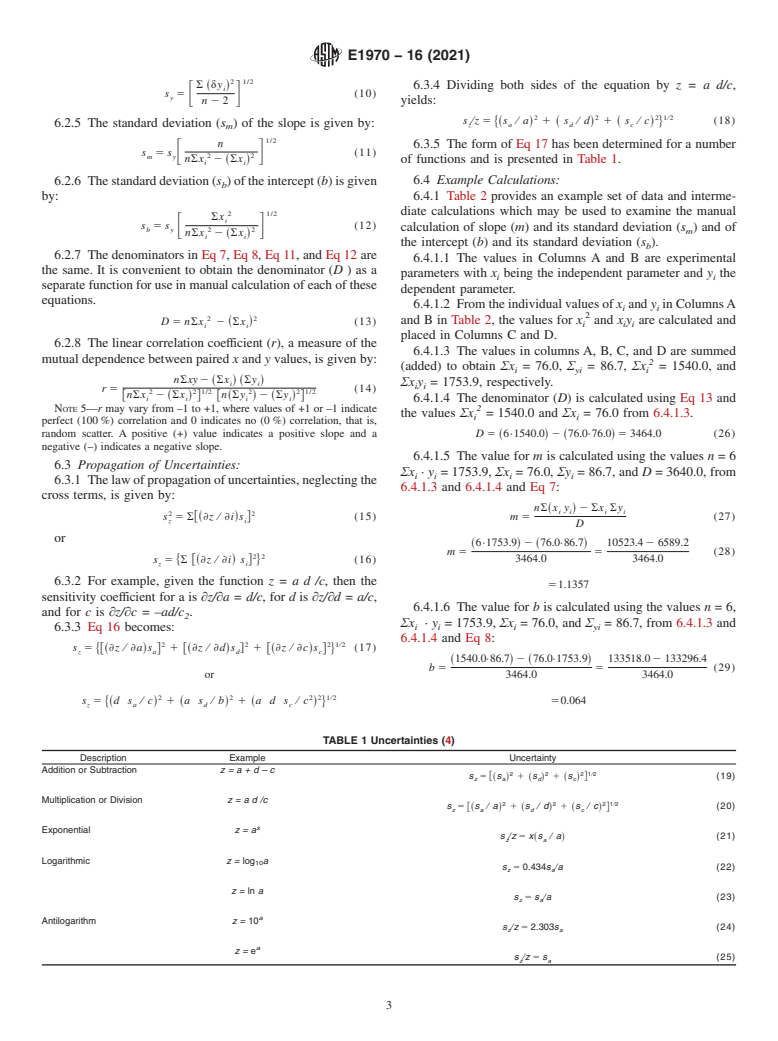
6.2.3 The individual dependent parameter varia
...
This document is not an ASTM standard and is intended only to provide the user of an ASTM standard an indication of what changes have been made to the previous version. Because
it may not be technically possible to adequately depict all changes accurately, ASTM recommends that users consult prior editions as appropriate. In all cases only the current version
of the standard as published by ASTM is to be considered the official document.
Designation: E1970 − 16 E1970 − 16 (Reapproved 2021)
Standard Practice for
Statistical Treatment of Thermoanalytical Data
This standard is issued under the fixed designation E1970; the number immediately following the designation indicates the year of
original adoption or, in the case of revision, the year of last revision. A number in parentheses indicates the year of last reapproval. A
superscript epsilon (´) indicates an editorial change since the last revision or reapproval.
1. Scope*Scope
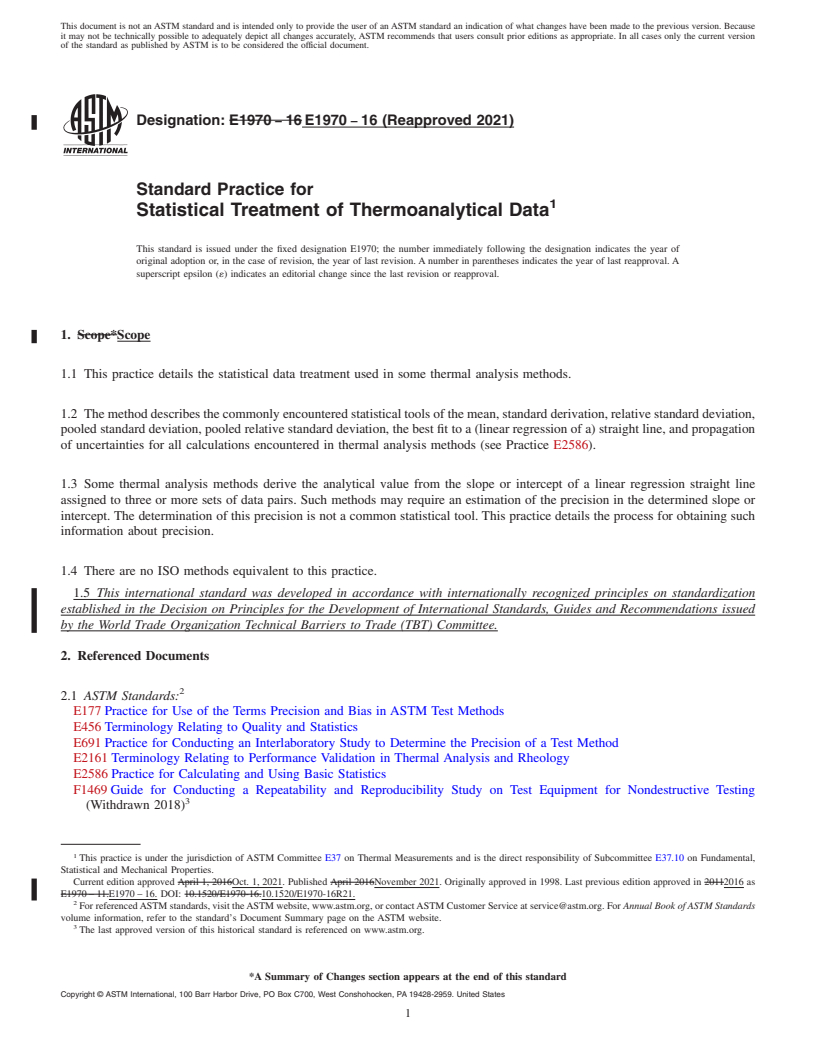
1.1 This practice details the statistical data treatment used in some thermal analysis methods.
1.2 The method describes the commonly encountered statistical tools of the mean, standard derivation, relative standard deviation,
pooled standard deviation, pooled relative standard deviation, the best fit to a (linear regression of a) straight line, and propagation
of uncertainties for all calculations encountered in thermal analysis methods (see Practice E2586).
1.3 Some thermal analysis methods derive the analytical value from the slope or intercept of a linear regression straight line
assigned to three or more sets of data pairs. Such methods may require an estimation of the precision in the determined slope or
intercept. The determination of this precision is not a common statistical tool. This practice details the process for obtaining such
information about precision.
1.4 There are no ISO methods equivalent to this practice.
1.5 This international standard was developed in accordance with internationally recognized principles on standardization
established in the Decision on Principles for the Development of International Standards, Guides and Recommendations issued
by the World Trade Organization Technical Barriers to Trade (TBT) Committee.
2. Referenced Documents
2.1 ASTM Standards:
E177 Practice for Use of the Terms Precision and Bias in ASTM Test Methods
E456 Terminology Relating to Quality and Statistics
E691 Practice for Conducting an Interlaboratory Study to Determine the Precision of a Test Method
E2161 Terminology Relating to Performance Validation in Thermal Analysis and Rheology
E2586 Practice for Calculating and Using Basic Statistics
F1469 Guide for Conducting a Repeatability and Reproducibility Study on Test Equipment for Nondestructive Testing
(Withdrawn 2018)
This practice is under the jurisdiction of ASTM Committee E37 on Thermal Measurements and is the direct responsibility of Subcommittee E37.10 on Fundamental,
Statistical and Mechanical Properties.
Current edition approved April 1, 2016Oct. 1, 2021. Published April 2016November 2021. Originally approved in 1998. Last previous edition approved in 20112016 as
E1970 – 11.E1970 – 16. DOI: 10.1520/E1970-16.10.1520/E1970-16R21.
For referenced ASTM standards, visit the ASTM website, www.astm.org, or contact ASTM Customer Service at service@astm.org. For Annual Book of ASTM Standards
volume information, refer to the standard’s Document Summary page on the ASTM website.
The last approved version of this historical standard is referenced on www.astm.org.
*A Summary of Changes section appears at the end of this standard
Copyright © ASTM International, 100 Barr Harbor Drive, PO Box C700, West Conshohocken, PA 19428-2959. United States
E1970 − 16 (2021)
3. Terminology
3.1 Definitions—The technical terms used in this practice are defined in Practice E177 and Terminologies E456 and E2161
including precision, relative standard deviation, repeatability, reproducibility, slope, standard deviation, thermoanalytical, and
variance.
3.2 Symbols (1):
m = slope
b = intercept
n = number of data sets (that is, x , y )
i i
x = an individual independent variable observation
i
y = an individual dependent variable observation
i
Σ = mathematical operation which means “the sum of all” for the term(s) following the operator
X = mean value
s = standard deviation
s = pooled standard deviation
pooled
s = standard deviation of the line intercept
b
s = standard deviation of the slope of a line
m
s = standard deviation of Y values
y
RSD = relative standard deviation
δy = variance in y parameter
i
r = correlation coefficient
R = gage reproducibility and repeatability (see Guide F1469) an estimation of the combined variation of repeatability and
reproducibility (2)
s = within laboratory repeatability standard deviation (see Practice E691)
r
s = between laboratory repeatability standard deviation (see Practice E691)
R
s = standard deviation of the “ith” measurement
i
4. Summary of Practice
4.1 The result of a series of replicate measurements of a value are typically reported as the mean value plus some estimation of
the precision in the mean value. The standard deviation is the most commonly encountered tool for estimating precision, but other
tools, such as relative standard deviation or pooled standard deviation, also may be encountered in specific thermoanalytical test
methods. This practice describes the mathematical process of achieving mean value, standard deviation, relative standard deviation
and pooled standard deviation.
4.2 In some thermal analysis experiments, a linear or a straight line, response is assumed and desired values are obtained from
the slope or intercept of the straight line through the experimental data. In any practical experiment, however, there will be some
uncertainty in the data so that results are scattered about such a straight line. The linear regression (also known as “least squares”)
method is an objective tool for determining the “best fit” straight line drawn through a set of experimental results and for obtaining
information concerning the precision of determined values.
4.2.1 For the purposes of this practice, it is assumed that the physical behavior, which the experimental results approximate, are
linear with respect to the controlled value, and may be represented by the algebraic function:
y 5 mx1b (1)
4.2.2 Experimental results are gathered in pairs, that is, for every corresponding x (controlled) value, there is a corresponding y
i i
(response) value.
4.2.3 The best fit (linear regression) approach assumes that all x values are exact and the y values (only) are subject to uncertainty.
i i
NOTE 1—In experimental practice, both x and y values are subject to uncertainty. If the uncertainty in x and y are of the same relative order of magnitude,
i i
other more elaborate fitting methods should be considered. For many sets of data, however, the results obtained by use of the assumption of exact values
for the x data constitute such a close approximation to those obtained by the more elaborate methods that the extra work and additional complexity of
i
the latter is hardly justified (2 and 3).
The boldface numbers in parentheses refer to a list of references at the end of this standard.
E1970 − 16 (2021)
4.2.4 The best fit approach seeks a straight line, which minimizes the uncertainty in the y value.
i
4.3 The law of propagation of uncertainties is a tool for estimating the precision in a determined value from the sum of the variance
of the respective measurements from which that value is derived weighted by the square of their respective sensitivity coefficients.
4.3.1 Variance is the square of the standard deviation(s). Conversely the standard deviation is the positive square root of the
variance.
4.3.2 The sensitivity coefficient is the partial derivative of the function with respect to the individual variable.
5. Significance and Use
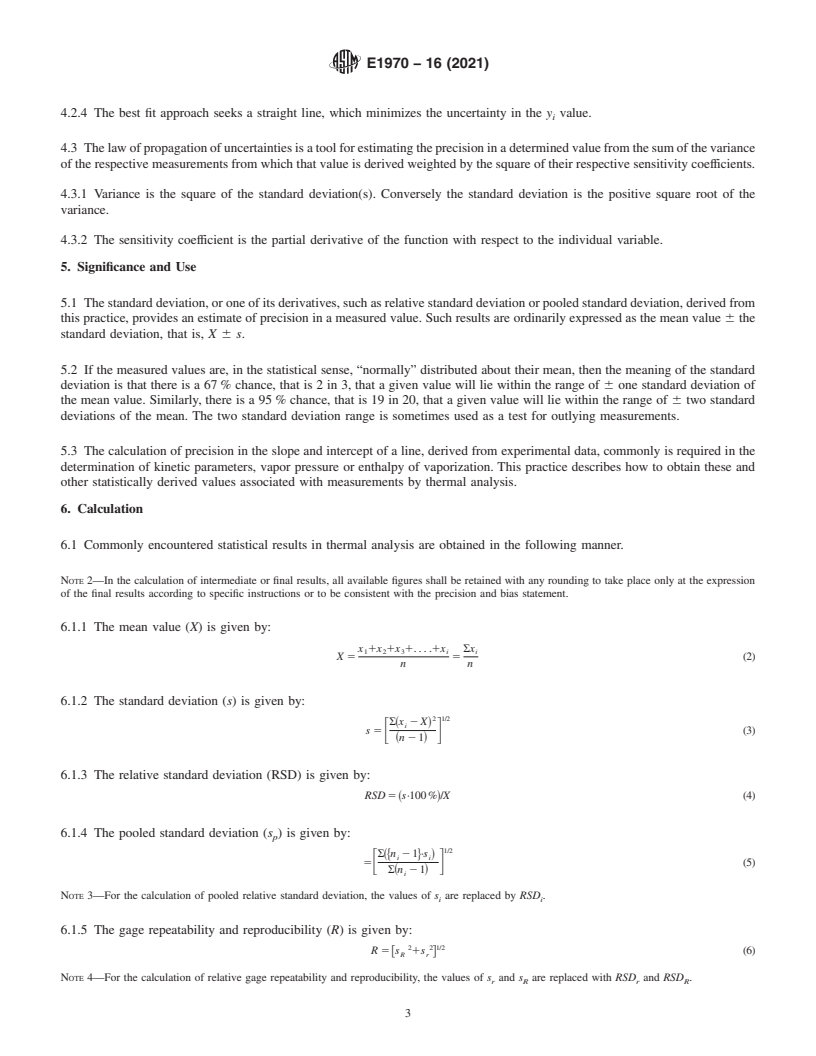
5.1 The standard deviation, or one of its derivatives, such as relative standard deviation or pooled standard deviation, derived from
this practice, provides an estimate of precision in a measured value. Such results are ordinarily expressed as the mean value 6 the
standard deviation, that is, X 6 s.
5.2 If the measured values are, in the statistical sense, “normally” distributed about their mean, then the meaning of the standard
deviation is that there is a 67 % chance, that is 2 in 3, that a given value will lie within the range of 6 one standard deviation of
the mean value. Similarly, there is a 95 % chance, that is 19 in 20, that a given value will lie within the range of 6 two standard
deviations of the mean. The two standard deviation range is sometimes used as a test for outlying measurements.
5.3 The calculation of precision in the slope and intercept of a line, derived from experimental data, commonly is required in the
determination of kinetic parameters, vapor pressure or enthalpy of vaporization. This practice describes how to obtain these and
other statistically derived values associated with measurements by thermal analysis.
6. Calculation
6.1 Commonly encountered statistical results in thermal analysis are obtained in the following manner.
NOTE 2—In the calculation of intermediate or final results, all available figures shall be retained with any rounding to take place only at the expression
of the final results according to specific instructions or to be consistent with the precision and bias statement.
6.1.1 The mean value (X) is given by:
x 1x 1x 1. . . .1x Σx
1 2 3 i i
X 5 5 (2)
n n
6.1.2 The standard deviation (s) is given by:
2 1/2
Σ x 2 X
~ !
i
s 5 (3)
F G
n 2 1
~ !
6.1.3 The relative standard deviation (RSD) is given by:
RSD 5 ~s·100 %!/X (4)
6.1.4 The pooled standard deviation (s ) is given by:
p
1/2
Σ n 2 1 ·s
~$ % !
i i
5 (5)
F G
Σ n 2 1
~ !
i
NOTE 3—For the calculation of pooled relative standard deviation, the values of s are replaced by RSD .
i i
6.1.5 The gage repeatability and reproducibility (R) is given by:
2 2 1/2
R 5 s 1s (6)
@ #
R r
NOTE 4—For the calculation of relative gage repeatability and reproducibility, the values of s and s are replaced with RSD and RSD
...
Questions, Comments and Discussion
Ask us and Technical Secretary will try to provide an answer. You can facilitate discussion about the standard in here.