


ASTM E573-01(2013)
(Practice)Standard Practices for Internal Reflection Spectroscopy
Standard Practices for Internal Reflection Spectroscopy
SIGNIFICANCE AND USE
4.1 These practices provide general guidelines for the good practice of internal reflection infrared spectroscopy.
SCOPE
1.1 These practices provide general recommendations covering the various techniques commonly used in obtaining internal reflection spectra.2,3 Discussion is limited to the infrared region of the electromagnetic spectrum and includes a summary of fundamental theory, a description of parameters that determine the results obtained, instrumentation most widely used, practical guidelines for sampling and obtaining useful spectra, and interpretation features specific for internal reflection.
1.2 The values stated in SI units are to be regarded as standard. No other units of measurement are included in this standard.
General Information
Standards Content (Sample)
NOTICE: This standard has either been superseded and replaced by a new version or withdrawn.
Contact ASTM International (www.astm.org) for the latest information
Designation:E573 −01 (Reapproved 2013)
Standard Practices for
Internal Reflection Spectroscopy
This standard is issued under the fixed designation E573; the number immediately following the designation indicates the year of
original adoption or, in the case of revision, the year of last revision.Anumber in parentheses indicates the year of last reapproval.A
superscript epsilon (´) indicates an editorial change since the last revision or reapproval.
1. Scope 4. Significance and Use
1.1 These practices provide general recommendations cov- 4.1 These practices provide general guidelines for the good
ering the various techniques commonly used in obtaining practice of internal reflection infrared spectroscopy.
2,3
internal reflection spectra. Discussion is limited to the
infrared region of the electromagnetic spectrum and includes a 5. Theory
summary of fundamental theory, a description of parameters
5.1 In his studies of total reflection at the interface between
that determine the results obtained, instrumentation most 6
two media of different refractive indices, Newton (1) discov-
widely used, practical guidelines for sampling and obtaining
ered that light extends into the rarer medium beyond the
useful spectra, and interpretation features specific for internal
reflecting surface (see Fig. 1). In internal reflection
reflection.
spectroscopy, IRS, this phenomenon is applied to obtain
1.2 The values stated in SI units are to be regarded as absorptionspectrabymeasuringtheinteractionofthepenetrat-
standard. No other units of measurement are included in this ingradiationwithanexternalmedium,whichwillbecalledthe
standard. sample (2,3). Theoretical explanation for the interaction
mechanisms for both absorbing and nonabsorbing samples is
2. Referenced Documents
provided by Snell’s law, the Fresnel equations (4), and the
Maxwell relationships (5).
2.1 ASTM Standards:
E131Terminology Relating to Molecular Spectroscopy
NOTE 1—To provide a basic understanding of internal reflection
phenomena applied to spectroscopy, a brief description of the theory
E168Practices for General Techniques of Infrared Quanti-
appears in Appendix X2. For a detailed theoretical discussion of the
tative Analysis (Withdrawn 2015)
subject, see (4).
E284Terminology of Appearance
6. Parameters of Reflectance Measurements
3. Terminology
6.1 Practical application of IRS depends on many precisely
3.1 Definitions of Terms and Symbols—For definitions of
controlled variables. Since an understanding of these variables
termsandsymbols,refertoTerminologiesE131andE284,and
isnecessaryforproperutilizationofthetechnique,descriptions
to Appendix X1.
of essential parameters are presented.
6.2 Angle of Incidence, θ—When θ is greater than the
1 criticalangle, θ ,totalinternalreflectionoccursattheinterface
c
These practices are under the jurisdiction of ASTM Committee E13 on
between the sample and the internal reflection element, IRE.
Molecular Spectroscopy and Separation Science and are the direct responsibility of
Subcommittee E13.03 on Infrared and Near Infrared Spectroscopy.
When θ is appreciably greater than θ , the reflection spectra
c
Current edition approved Jan. 1, 2013. Published January 2013. Originally
most closely resemble transmission spectra. When θ is less
approved in 1976. Last previous edition approved in 2007 as E573–01 (2007).
than θ , radiation is both refracted and internally reflected,
DOI: 10.1520/E0573-01R13.
c
Internal Reflection Spectroscopy, IRS, is the accepted nomenclature for the
generally leading to spectral distortions. θ should be selected
technique described in these practices. Other terms are sometimes used which
far enough away from the average critical angle of the
include: Attenuated Total Reflection, ATR; Frustrated Total Reflection, FTR;
sample—IRE combination that the change of θ through the
Multiple Internal Reflection, MIR; and other less commonly used terms. In older c
literature, one may find references to Frustrated Total Internal Reflection, FTIR. region of changing index (which is related to the presence of
This should not be confused with Fourier Transform Infrared Spectroscopy FT-IR.
the absorption band of the sample) has a minimal effect on the
Other terms sometimes used for referring to the internal reflection element are:
shapeoftheinternalreflectionband.Increasingθdecreasesthe
ATR crystal, MIR plate, or sample plate.
4 number of reflections, and reduces penetration. In practice,
For referenced ASTM standards, visit the ASTM website, www.astm.org, or
contact ASTM Customer Service at service@astm.org. For Annual Book of ASTM
Standards volume information, refer to the standard’s Document Summary page on
the ASTM website.
5 6
The last approved version of this historical standard is referenced on Theboldfacenumbersinparenthesesrefertothelistofreferencesattheendof
www.astm.org. these practices.
Copyright © ASTM International, 100 Barr Harbor Drive, PO Box C700, West Conshohocken, PA 19428-2959. United States
E573−01 (2013)
necessary to select an IRE with a refractive index considerably
greater than the mean index of the sample.
6.4.1 The refractive index of a material undergoes abrupt
changes in the region of an absorption band. Fig. 3 (6) shows
thechangeinrefractiveindexofasampleacrossanabsorption
band as a function of wavelength. When an IRE of index n is
A
selected,theremaybeapointatwhichtheindexofthesample
is greater than that of the IRE.At this wavelength, there is no
θatwhichtotalinternalreflectioncantakeplace,andnearlyall
of the energy passes into the sample. The absorption band
NOTE 1—The ray penetrates a fraction of a wavelength (d ) beyond the
p resulting in this case will be broadened toward longer
reflecting surface into the rarer medium of refractive index n (the
wavelengths, and hence appear distorted. When an IRE of
sample), and there is a certain displacement (D) upon reflection. θ is the
index n is selected, there is no point at which the index of the
B
angleofincidenceoftherayinthedensermedium,ofrefractiveindex, n ,
sample exceeds it. On the long wavelength side, however, the
at the interface between the two media.
FIG. 1Schematic Representation of Path of a Ray of Light for refractive indexes approach each other. This results in an
Total Internal Reflection
absorptionbandthatislessdistorted,butthatisstillbroadened
on the long wavelength side. With an IRE of index n,a
C
considerably higher refractive index than that of the sample,
there is some angular spread in a focused beam. For instru-
ments that utilize f4.5 optics in the sample compartment, there the index variation of the sample causes no obvious distortion
of the absorption band.
is a beam spread of 6 5°, but the beam spread in the IRE is
smaller because of its refractive index.The value will increase
6.5 Depth of Penetration, d —The distance into the rarer
p
as lower f-number optics are utilized. This beam spread
medium at which the amplitude of the penetrating radiation
produces a corresponding distribution of effective paths and −1
falls to e of its value at the surface is a function of the
effective depth of penetrations.
wavelength of the radiation, the refractive indexes of both the
6.3 Number of Reflections, N—N is an important factor in IREandthesample,andtheangleofincidenceoftheradiation
determining the sensitivity of the IRE. Where multiple reflec- at the interface.
tions are employed, internal reflection occurs a number of 6.5.1 The depth of penetration, d , can be calculated as
p
times along the length of the IRE depending on its length, l, follows:
thickness, t, and on the angle of incidence, θ, of the radiant
λ
d 5 (3)
beam.
p 2 2 ½
2 π sin θ 2 n
~ !
NOTE 2—The length of an IRE is defined as the distance between the
λ
centers of the entrance and exit apertures.
where: λ 5 5wavelengthofradiationintheIRE.
n
6.3.1 Absorption occurs with each reflection (see Fig. 2),
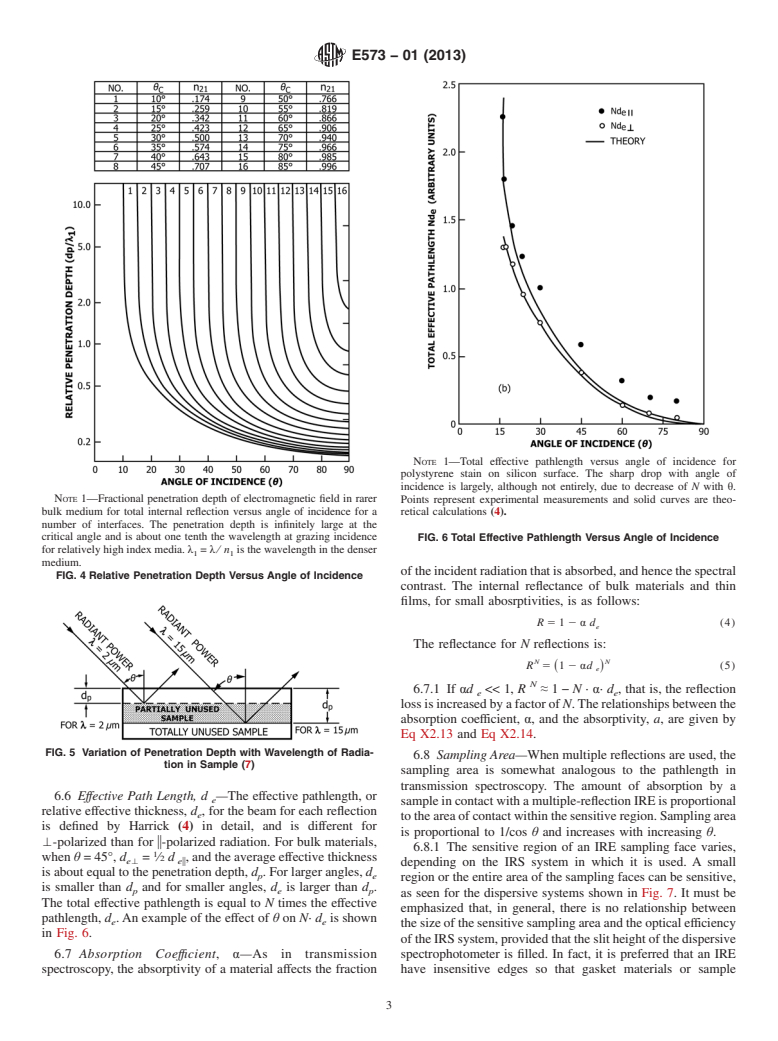
The depth of penetration increases as the angle of incidence
giving rise to an absorption spectrum, the intensity of which
decreases, and becomes infinitely large as θ approaches the
depends on N. For single-pass IREs, N can be calculated using
critical angle (see Figs. 4 and 5) (7).
the following relationship:
l
N 5 cotθ (1)
S D
t
For double-pass IREs:
l
N 5 2 cotθ (2)
S D
t
Many single-pass IREs employ approximately 25 reflec-
tions.
NOTE3—NmustbeanoddintegerforIREsintheshapeofatrapezoid,
and an even integer for IREs in the shape of a parallelogram.
6.4 Relative Refractive Index, n , of the Sample, n , and
21 2
IRE, n;(n =n /n )—Refractive index matching controls the
1 21 2 1
spectral contrast. If the indexes of the sample and the IRE
approacheachother,banddistortionscanoccur.Therefore,itis
Solid Line—Refractive index of sample.
Dotted Line—Absorption band of sample.
Dashed Lines—Refractive indices of reflector plates.
FIG. 2 Multiple Internal Reflection Effect FIG. 3 Refractive Index Versus Wavelength
E573−01 (2013)
NOTE 1—Total effective pathlength versus angle of incidence for
polystyrene stain on silicon surface. The sharp drop with angle of
incidence is largely, although not entirely, due to decrease of N with θ.
NOTE 1—Fractional penetration depth of electromagnetic field in rarer Points represent experimental measurements and solid curves are theo-
bulk medium for total internal reflection versus angle of incidence for a retical calculations (4).
number of interfaces. The penetration depth is infinitely large at the
critical angle and is about one tenth the wavelength at grazing incidence
FIG. 6Total Effective Pathlength Versus Angle of Incidence
forrelativelyhighindexmedia. λ = λ⁄ n isthewavelengthinthedenser
1 1
medium.
oftheincidentradiationthatisabsorbed,andhencethespectral
FIG. 4Relative Penetration Depth Versus Angle of Incidence
contrast. The internal reflectance of bulk materials and thin
films, for small abosrptivities, is as follows:
R 5 1 2 α d (4)
e
The reflectance for N reflections is:
N N
R 5 1 2 αd (5)
~ !
e
N
6.7.1 If αd << 1, R ≈1− N · α· d , that is, the reflection
e e
lossisincreasedbyafactorofN.Therelationshipsbetweenthe
absorption coefficient, α, and the absorptivity, a, are given by
Eq X2.13 and Eq X2.14.
FIG. 5 Variation of Penetration Depth with Wavelength of Radia-
6.8 Sampling Area—Whenmultiplereflectionsareused,the
tion in Sample (7)
sampling area is somewhat analogous to the pathlength in
transmission spectroscopy. The amount of absorption by a
6.6 Effective Path Length, d —The effective pathlength, or
e
sampleincontactwithamultiple-reflectionIREisproportional
relative effective thickness, d , for the beam for each reflection
e
totheareaofcontactwithinthesensitiveregion.Samplingarea
is defined by Harrick (4) in detail, and is different for
is proportional to 1/cos θ and increases with increasing θ.
'-polarized than for i-polarized radiation. For bulk materials,
6.8.1 The sensitive region of an IRE sampling face varies,
whenθ=45°, d = ⁄2 d ,andtheaverageeffectivethickness
e' ei
depending on the IRS system in which it is used. A small
isaboutequaltothepenetrationdepth, d .Forlargerangles, d
p e
regionortheentireareaofthesamplingfacescanbesensitive,
is smaller than d and for smaller angles, d is larger than d .
p e p
as seen for the dispersive systems shown in Fig. 7. It must be
The total effective pathlength is equal to N times the effective
emphasized that, in general, there is no relationship between
pathlength, d .An example of the effect of θ on N· d is shown
e e
thesizeofthesensitivesamplingareaandtheopticalefficiency
in Fig. 6.
oftheIRSsystem,providedthattheslitheightofthedispersive
6.7 Absorption Coeffıcient, α—As in transmission spectrophotometer is filled. In fact, it is preferred that an IRE
spectroscopy, the absorptivity of a material affects the fraction have insensitive edges so that gasket materials or sample
E573−01 (2013)
IRAs are presented in Fig. 8. For double-beam operation, it is
preferred that an IRAidentical to that used in the sample beam
be used in the reference beam in order to compensate for
surface scatter, atmospheric absorptions, or absorptions in the
IRE. When using an IRAin a FT-IR spectrometer, a reference
FIG. 7 Sensitive Sampling Areas of IRE Plates spectrum (or background) is usually recorded using the same
IRE with no sample in contact with the crystal. Very careful
cleaning and sampling procedures (more than usual) are
holders do not cause spectral interference. It is important that required here. Spectral verification of IRE cleanliness is
samples be positioned so that they lie completely across the
essential. Internal reflection equipment includes the following:
width of the sensitive area. For accessories utilizing single- 7.1.1 The IRAs designed to be placed into the sampling
reflection prisms and hemicylinders, the entire sample face
compartment of a spectrophotometer. These are of the follow-
shouldbecovered.Ifthisareaisnotcompletelycoveredbythe ing types: (a) variable-angle single internal reflection; (b)
sample, radiation bypasses the sample and the effect will be
fixed-angle multiple internal reflection (θ usually set at 45°),
similar to a transmission cell with an air bubble in it. Knowing and (c) variable-angle multiple internal reflection (θ is either
the sensitive sampling area on an IRE is important when the continuously variable, usually between 30 and 60°, or a choice
sample is limited and it is desirable to place the sample on the of angles is preset by the manufacturer, usually at 30, 45, and
IREinthemostefficientmanner (8).Thesensitiveregionofan 60°. In order to have the θ that is specified on the attachment,
IRE sampling face may differ quite radically when used in an an IRE for that same θ must be used.) (d) platforms for
interferometer. The focused image is nearly circular and may supporting fixed-angle plates in a horizontal position, and (e)
not fill the vertical dimension of the crystal but often will IRAs for supporting prism IREs of various geometry.
overfillthewidthoftheIREface.Thisresultsinvignettingand 7.1.2 Goniometers—Goniometers are essential for absolute
introduces small wavenumber errors in Fourier Transform intensity measurements.
spectroscopy. The problem of overfilling the entrance aperture 7.1.3 Horizontal ATR Attachments—Thisfamilyofaccesso-
canbeminimizedbyutilizingbeamcondensingoptics,butthis ries is based on single-pass IRE geometries, which may be of
will increase the angular spread of the incident rays. fixed-angle or variable-angle construction. They are designed
so that only one crystal face is accessible to the user in a
NOTE4—ItisrecommendedthatanIREwithaverticaldimensiononly
horizontalplane.Somedesignshavethecrystalsetintothetop
slightly larger than the focuse
...
Questions, Comments and Discussion
Ask us and Technical Secretary will try to provide an answer. You can facilitate discussion about the standard in here.