


ASTM D6621-00(2017)
(Practice)Standard Practice for Performance Testing of Process Analyzers for Aromatic Hydrocarbon Materials
Standard Practice for Performance Testing of Process Analyzers for Aromatic Hydrocarbon Materials
SIGNIFICANCE AND USE
5.1 Performance testing of on-line analyzers is critical to their proper performance within predictable levels of precision and accuracy. This practice can affect production efficiency and certification of aromatic hydrocarbon materials.
SCOPE
1.1 This practice serves as a practical guide for the performance testing of process stream analyzers specifically for measuring chemical or physical characteristics of liquid aromatic hydrocarbon materials for production or certification of these materials. The practice may be applicable to other hydrocarbon stream analyzers as well.
1.2 Only external methods (complete substitution of the process stream with a standard) of control sample introduction are included. Internal methods are beyond the scope of this practice.
1.3 Methods for resetting key operational parameters of analyzers to match predefined limits are provided by vendors and are not included in this practice.
1.4 Analyzer validation procedures are covered in Practices D3764 and D6122, not in this practice.
1.5 Procedures for statistically interpreting data from automatic sampling process stream analyzers are outlined.
1.6 The implementation of this practice requires that the analyzer be installed according to APIRP-550 (1),2 and be in agreement with the analyzer supplier’s recommendations. Also, it assumes that the analyzer is designed to monitor the specific material parameter of interest, and that at the time of initial or periodic validation, the analyzer was operating at the conditions specified by the manufacturer and consistently with the primary test method.
1.7 The units of measure used in this practice shall be the same as those applicable to the test primary method used for analyzer validation.
1.8 This standard does not purport to address all of the safety concerns, if any, associated with its use. It is the responsibility of the user of this standard to establish appropriate safety and health practices, and determine the applicability of regulatory limitations prior to use.
1.9 This international standard was developed in accordance with internationally recognized principles on standardization established in the Decision on Principles for the Development of International Standards, Guides and Recommendations issued by the World Trade Organization Technical Barriers to Trade (TBT) Committee.
General Information
Buy Standard
Standards Content (Sample)
NOTICE: This standard has either been superseded and replaced by a new version or withdrawn.
Contact ASTM International (www.astm.org) for the latest information
Designation: D6621 − 00 (Reapproved 2017)
Standard Practice for
Performance Testing of Process Analyzers for Aromatic
Hydrocarbon Materials
This standard is issued under the fixed designation D6621; the number immediately following the designation indicates the year of
original adoption or, in the case of revision, the year of last revision.Anumber in parentheses indicates the year of last reapproval.A
superscript epsilon (´) indicates an editorial change since the last revision or reapproval.
1. Scope priate safety and health practices, and determine the applica-
bility of regulatory limitations prior to use.
1.1 This practice serves as a practical guide for the perfor-
1.9 This international standard was developed in accor-
mance testing of process stream analyzers specifically for
dance with internationally recognized principles on standard-
measuring chemical or physical characteristics of liquid aro-
ization established in the Decision on Principles for the
matic hydrocarbon materials for production or certification of
Development of International Standards, Guides and Recom-
these materials. The practice may be applicable to other
mendations issued by the World Trade Organization Technical
hydrocarbon stream analyzers as well.
Barriers to Trade (TBT) Committee.
1.2 Only external methods (complete substitution of the
process stream with a standard) of control sample introduction
2. Referenced Documents
are included. Internal methods are beyond the scope of this
2.1 ASTM Standards:
practice.
D3764PracticeforValidationofthePerformanceofProcess
1.3 Methods for resetting key operational parameters of
Stream Analyzer Systems
analyzers to match predefined limits are provided by vendors D4177Practice for Automatic Sampling of Petroleum and
and are not included in this practice.
Petroleum Products
D6122Practice for Validation of the Performance of Multi-
1.4 Analyzer validation procedures are covered in Practices
variate Online, At-Line, Field and Laboratory Infrared
D3764 and D6122, not in this practice.
Spectrophotometer, and Raman Spectrometer BasedAna-
1.5 Procedures for statistically interpreting data from auto-
lyzer Systems
matic sampling process stream analyzers are outlined.
E456Terminology Relating to Quality and Statistics
1.6 The implementation of this practice requires that the E1655 Practices for Infrared Multivariate Quantitative
analyzer be installed according to APIRP-550 (1), and be in Analysis
agreement with the analyzer supplier’s recommendations.
3. Terminology
Also, it assumes that the analyzer is designed to monitor the
specific material parameter of interest, and that at the time of
3.1 Definitions:
initial or periodic validation, the analyzer was operating at the
3.1.1 accuracy, n—closeness of agreement between a test
conditions specified by the manufacturer and consistently with
result and an accepted reference value.
the primary test method.
3.1.2 analyzer output, n—signal that is proportional to the
1.7 The units of measure used in this practice shall be the
quality parameter being measured and suitable for input to
same as those applicable to the test primary method used for readout instrumentation.
analyzer validation.
3.1.2.1 Discussion—It may be pneumatic, electrical, digital,
etc., and expressed as psi, mv, sec., etc.
1.8 This standard does not purport to address all of the
safety concerns, if any, associated with its use. It is the
3.1.3 analyzer result, n—numerical estimate of a physical,
responsibility of the user of this standard to establish appro- chemical, or quality parameter produced by applying the
calibration model to the analyzer output signal.
3.1.4 bias, n—the difference between the expectation of the
This practice is under the jurisdiction ofASTM Committee D16 on Aromatic,
results and an accepted reference value.
Industrial, Specialty and Related Chemicals and is the direct responsibility of
Subcommittee D16.09 on On-Line Analysis.
CurrenteditionapprovedJuly1,2017.PublishedJuly2017.Originallyapproved
in 2000. Last previous edition approved in 2012 as D6621–00 (2012). DOI: For referenced ASTM standards, visit the ASTM website, www.astm.org, or
10.1520/D6621-00R17. contact ASTM Customer Service at service@astm.org. For Annual Book of ASTM
Theboldfacenumbersinparenthesesrefertothelistofreferencesattheendof Standards volume information, refer to the standard’s Document Summary page on
this practice. the ASTM website.
Copyright © ASTM International, 100 Barr Harbor Drive, PO Box C700, West Conshohocken, PA 19428-2959. United States
D6621 − 00 (2017)
3.1.5 control sample, n—material similar to the process firstconfiguredorreconfigured(initialvalidation),andthenon
stream that is stable over long periods of time so that its a periodic basis (periodic validation), as described in Practice
parametersmaybemeasuredreproduciblyinperformancetests D3764.
to characterize analyzer precision and accuracy.
3.2 For additional definitions, see Appendix X1.
3.1.5.1 Discussion—May be a pure compound, standard
mixture, or a sample from the process stream. Its parameters
4. Summary of Practice
are used to plot statistical process control charts to define
4.1 This practice standardizes aromatic hydrocarbon
analyzer precision in normal operation.
process-analyzer performance testing practices, or processes
3.1.6 external performance testing, n—procedure involving
formaintainingaccurateandpreciseanalyzermeasurements.It
complete substitution of the process/product stream measured
is used with methods for the measurement and certification of
by the analyzer with a control sample stream to measure the
aromatic hydrocarbon materials applied to continuous on-line
analyzer’s precision and possibly accuracy (if the control
analyzers. These methods are generally under the control of
sample’s true value is known).
CommitteeD16onAromatic,Industrial,SpecialtyandRelated
3.1.7 internal performance testing, n—procedure involving
Chemicals. It is meant as a practical guide for persons setting
the addition of a known quantity of a standard material
up and maintaining these analyzers in a process (non-
homogeneously into the process/product stream measured by
laboratory) environment. They should apply it, with their
the analyzer to measure the analyzer’s precision and possibly
knowledge of the analyzer’s operation and of how the process
accuracy (if the sample material’s true value is known).
analyzer results are to be used, to maintain and optimize
3.1.8 linearity, n—parameter ranges where the analyzer’s analyzer operation.
results do and do not approximate a straight line.
5. Significance and Use
3.1.9 performance testing of an analyzer, n—mechanical
and statistical procedure for routinely checking the accuracy
5.1 Performance testing of on-line analyzers is critical to
and precision of an analyzer’s results against historical accu-
their proper performance within predictable levels of precision
racy and precision for a control sample.
andaccuracy.Thispracticecanaffectproductionefficiencyand
certification of aromatic hydrocarbon materials.
3.1.10 precision, n—closeness of agreement of independent
testresultsofthesamechemicalorphysicalpropertyofagiven
6. System Components
material obtained under stipulated conditions.
3.1.10.1 Discussion—Expressed in terms of dispersion of
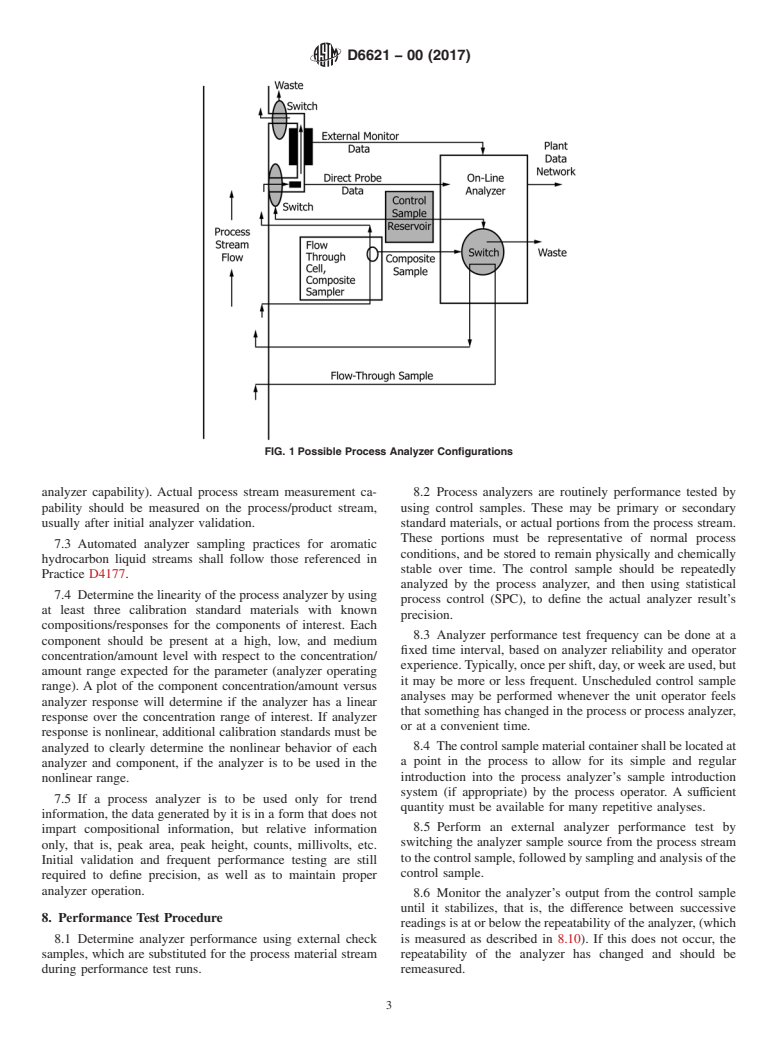
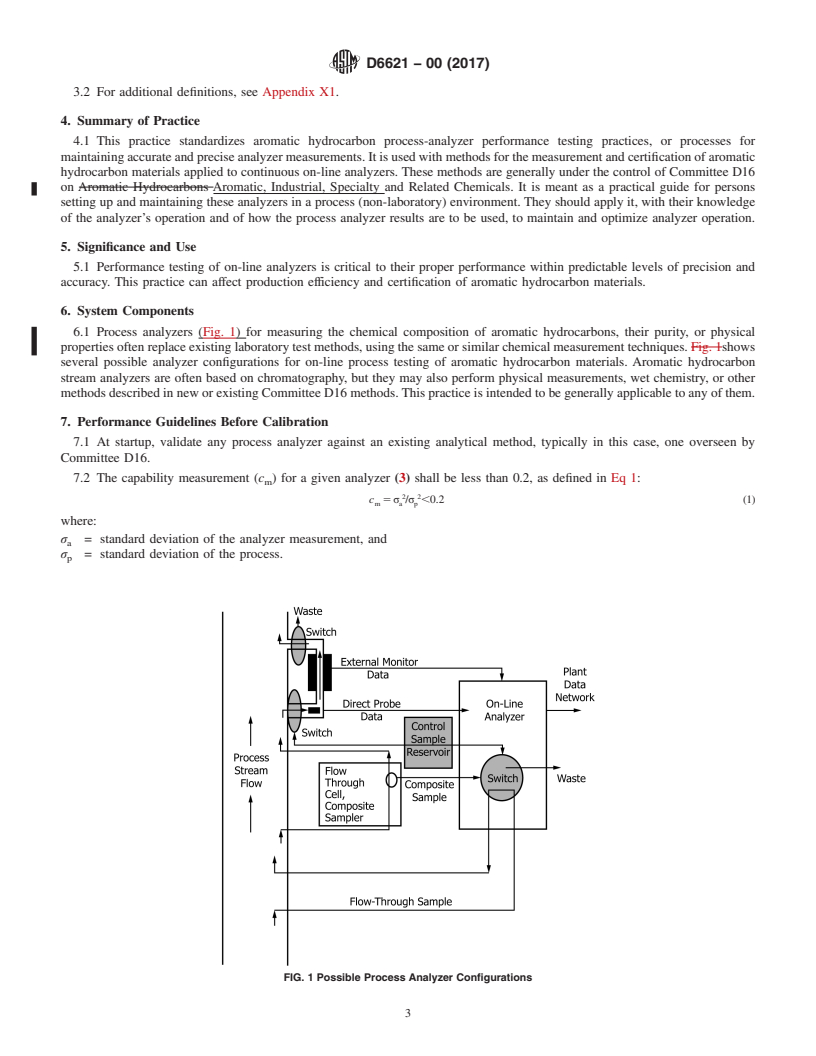
6.1 Process analyzers (Fig. 1) for measuring the chemical
test results around the arithmetic mean, usually as variance,
compositionofaromatichydrocarbons,theirpurity,orphysical
standard deviation, repeatability or reproducibility, or both.
propertiesoftenreplaceexistinglaboratorytestmethods,using
3.1.11 repeatability of an analyzer, n—difference between the same or similar chemical measurement techniques. shows
two successive analyzer results measured in a short time several possible analyzer configurations for on-line process
interval that would be exceeded in the long run in only 1 case testing of aromatic hydrocarbon materials.Aromatic hydrocar-
in 20 (5% of the time) when the analyzer is operated on a
bon stream analyzers are often based on chromatography, but
flowing sample of uniform quality. they may also perform physical measurements, wet chemistry,
or other methods described in new or existing Committee D16
3.1.12 reproducibility of an analyzer, n—differencebetween
methods.Thispracticeisintendedtobegenerallyapplicableto
asingleresultfromeachoftwoidenticalanalyzersystemsthat
any of them.
wouldbeexceededinthelongruninonly1casein20(5%of
the time) when the two systems are operated at different sites
7. Performance Guidelines Before Calibration
by different operators, but on identical samples.
7.1 At startup, validate any process analyzer against an
3.1.13 rule violation, n—condition when a point value or
existing analytical method, typically in this case, one overseen
pattern of points in a statistical process control chart statisti-
by Committee D16.
cally exceeds the defined probability of its occurrence, as
defined by the Western Electric rules (2) being used.
7.2 The capability measurement (c ) for a given analyzer
m
3.1.14 spot sample, n—representative material resembling
(3) shall be less than 0.2, as defined in Eq 1:
the stream being monitored, an identical portion of which is
2 2
c 5σ /σ ,0.2 (1)
m a p
analyzedbothinaprocessanalyzerandbyalaboratoryteston
where:
a non-scheduled basis for periodic validation testing.
3.1.14.1 Discussion—May be the same material as the
σ = standard deviation of the analyzer measurement, and
a
σ = standard deviation of the process.
control sample.
p
3.1.15 validation of an analyzer, n—process to identify how
The variance (standard deviation squared) of the analyzer
comparableananalyzer’sresultsarestatisticallytoresultsfrom should be less than 20% of the variance of the process, so that
the primary method, or to define how the analyzer’s results
the analyzer measurement can be useful for detecting changes
compare to the primary method’s results in precision and in the process. The expected capability for a process analyzer
accuracy.
measurement may be available from the vendor for a specific
3.1.15.1 Discussion—Must be done when the analyzer is application before installation of the analyzer (advertised
D6621 − 00 (2017)
FIG. 1 Possible Process Analyzer Configurations
analyzer capability). Actual process stream measurement ca- 8.2 Process analyzers are routinely performance tested by
pability should be measured on the process/product stream, using control samples. These may be primary or secondary
usually after initial analyzer validation. standard materials, or actual portions from the process stream.
These portions must be representative of normal process
7.3 Automated analyzer sampling practices for aromatic
conditions, and be stored to remain physically and chemically
hydrocarbon liquid streams shall follow those referenced in
stable over time. The control sample should be repeatedly
Practice D4177.
analyzed by the process analyzer, and then using statistical
7.4 Determine the linearity of the process analyzer by using
process control (SPC), to define the actual analyzer result’s
at least three calibration standard materials with known
precision.
compositions/responses for the components of interest. Each
8.3 Analyzer performance test frequency can be done at a
component should be present at a high, low, and medium
fixed time interval, based on analyzer reliability and operator
concentration/amount level with respect to the concentration/
experience.Typically,oncepershift,day,orweekareused,but
amount range expected for the parameter (analyzer operating
it may be more or less frequent. Unscheduled control sample
range). A plot of the component concentration/amount versus
analyses may be performed whenever the unit operator feels
analyzer response will determine if the analyzer has a linear
that something has changed in the process or process analyzer,
response over the concentration range of interest. If analyzer
or at a convenient time.
response is nonlinear, additional calibration standards must be
8.4 Thecontrolsamplematerialcontainershallbelocatedat
analyzed to clearly determine the nonlinear behavior of each
a point in the process to allow for its simple and regular
analyzer and component, if the analyzer is to be used in the
introduction into the process analyzer’s sample introduction
nonlinear range.
system (if appropriate) by the process operator. A sufficient
7.5 If a process analyzer is to be used only for trend
quantity must be available for many repetitive analyses.
information, the data generated by it is in a form that does not
8.5 Perform an external analyzer performance test by
impart compositional information, but relative information
switching the analyzer sample source from the process stream
only, that is, peak area, peak height, counts, millivolts, etc.
tothecontrolsample,followedbysamplingandanalysisofthe
Initial validation and frequent performance testing are still
control sample.
required to define precision, as well as to maintain proper
analyzer operation.
8.6 Monitor the analyzer’s output from the control sample
until it stabilizes, that is, the difference between successive
8. Performance Test Procedure
readingsisatorbelowtherepeatabilityoftheanalyzer,(which
8.1 Determine analyzer performance using external check is measured as described in 8.10). If this does not occur, the
samples, which are substituted for the process material stream repeatability of the analyzer has changed and should be
during performance test runs. remeasured.
D6621 − 00 (2017)
8.7 Afterstabilizationoftheanalyzer,measureatleastthree change. An indication of analyzer precision should always be
successive results on the control sample and average the made available to persons receiving data from the analyzer.
results. Plot the average of these three results in a SPC chart Any large changes in an analyzer’s precision should immedi-
using any statistically correct method of data handling and ately be brought to the attention of the user of the analyzer’s
control chart construction (4). data.
8.8 SPC charts of the control sample data shall be used to 8.11 Perform periodic analyzer validation on a scheduled
basisoveralongertime(forexample,weeklyormonthly)than
help decide if the analyzer needs to have its response param-
eters reset, (5) or if it is working within previous statistical performance testing, or whenever some significant aspect of
the analyzer has changed (see Table 1). This activity reestab-
levels and should be left alone. SPC results and operator
experience should be used to determine subsequent actions, lishes the analyzer’s statistical performance with the primary
...
This document is not an ASTM standard and is intended only to provide the user of an ASTM standard an indication of what changes have been made to the previous version. Because
it may not be technically possible to adequately depict all changes accurately, ASTM recommends that users consult prior editions as appropriate. In all cases only the current version
of the standard as published by ASTM is to be considered the official document.
Designation: D6621 − 00 (Reapproved 2012) D6621 − 00 (Reapproved 2017)
Standard Practice for
Performance Testing of Process Analyzers for Aromatic
Hydrocarbon Materials
This standard is issued under the fixed designation D6621; the number immediately following the designation indicates the year of
original adoption or, in the case of revision, the year of last revision. A number in parentheses indicates the year of last reapproval. A
superscript epsilon (´) indicates an editorial change since the last revision or reapproval.
1. Scope
1.1 This practice serves as a practical guide for the performance testing of process stream analyzers specifically for measuring
chemical or physical characteristics of liquid aromatic hydrocarbon materials for production or certification of these materials. The
practice may be applicable to other hydrocarbon stream analyzers as well.
1.2 Only external methods (complete substitution of the process stream with a standard) of control sample introduction are
included. Internal methods are beyond the scope of this practice.
1.3 Methods for resetting key operational parameters of analyzers to match predefined limits are provided by vendors and are
not included in this practice.
1.4 Analyzer validation procedures are covered in Practices D3764 and D6122, not in this practice.
1.5 Procedures for statistically interpreting data from automatic sampling process stream analyzers are outlined.
1.6 The implementation of this practice requires that the analyzer be installed according to APIRP-550 (1), and be in agreement
with the analyzer supplier’s recommendations. Also, it assumes that the analyzer is designed to monitor the specific material
parameter of interest, and that at the time of initial or periodic validation, the analyzer was operating at the conditions specified
by the manufacturer and consistently with the primary test method.
1.7 The units of measure used in this practice shall be the same as those applicable to the test primary method used for analyzer
validation.
1.8 This standard does not purport to address all of the safety concerns, if any, associated with its use. It is the responsibility
of the user of this standard to establish appropriate safety and health practices, and determine the applicability of regulatory
limitations prior to use.
1.9 This international standard was developed in accordance with internationally recognized principles on standardization
established in the Decision on Principles for the Development of International Standards, Guides and Recommendations issued
by the World Trade Organization Technical Barriers to Trade (TBT) Committee.
2. Referenced Documents
2.1 ASTM Standards:
D3764 Practice for Validation of the Performance of Process Stream Analyzer Systems
D4177 Practice for Automatic Sampling of Petroleum and Petroleum Products
D6122 Practice for Validation of the Performance of Multivariate Online, At-Line, and Laboratory Infrared Spectrophotometer
Based Analyzer Systems
E456 Terminology Relating to Quality and Statistics
E1655 Practices for Infrared Multivariate Quantitative Analysis
3. Terminology
3.1 Definitions:
3.1.1 accuracy, n—closeness of agreement between a test result and an accepted reference value.
This practice is under the jurisdiction of ASTM Committee D16 on Aromatic Hydrocarbons Aromatic, Industrial, Specialty and Related Chemicals and is the direct
responsibility of Subcommittee D16.04 on Instrumental Analysis.
Current edition approved June 1, 2012July 1, 2017. Published August 2012July 2017. Originally approved in 2000. Last previous edition approved in 20062012 as
ε1
D6621 – 00 (2006)(2012). . DOI: 10.1520/D6621-00R12.10.1520/D6621-00R17.
The boldface numbers in parentheses refer to the list of references at the end of this practice.
For referenced ASTM standards, visit the ASTM website, www.astm.org, or contact ASTM Customer Service at service@astm.org. For Annual Book of ASTM Standards
volume information, refer to the standard’s Document Summary page on the ASTM website.
Copyright © ASTM International, 100 Barr Harbor Drive, PO Box C700, West Conshohocken, PA 19428-2959. United States
D6621 − 00 (2017)
3.1.2 analyzer output, n—signal that is proportional to the quality parameter being measured and suitable for input to readout
instrumentation.
3.1.2.1 Discussion—
It may be pneumatic, electrical, digital, etc., and expressed as psi, mv, sec., etc.
3.1.3 analyzer result, n—numerical estimate of a physical, chemical, or quality parameter produced by applying the calibration
model to the analyzer output signal.
3.1.4 bias, n—the difference between the expectation of the results and an accepted reference value.
3.1.5 control sample, n—material similar to the process stream that is stable over long periods of time so that its parameters may
be measured reproducibly in performance tests to characterize analyzer precision and accuracy.
3.1.5.1 Discussion—
May be a pure compound, standard mixture, or a sample from the process stream. Its parameters are used to plot statistical process
control charts to define analyzer precision in normal operation.
3.1.6 external performance testing, n—procedure involving complete substitution of the process/product stream measured by
the analyzer with a control sample stream to measure the analyzer’s precision and possibly accuracy (if the control sample’s true
value is known).
3.1.7 internal performance testing, n—procedure involving the addition of a known quantity of a standard material
homogeneously into the process/product stream measured by the analyzer to measure the analyzer’s precision and possibly
accuracy (if the sample material’s true value is known).
3.1.8 linearity, n—parameter ranges where the analyzer’s results do and do not approximate a straight line.
3.1.9 performance testing of an analyzer, n—mechanical and statistical procedure for routinely checking the accuracy and
precision of an analyzer’s results against historical accuracy and precision for a control sample.
3.1.10 precision, n—closeness of agreement of independent test results of the same chemical or physical property of a given
material obtained under stipulated conditions.
3.1.10.1 Discussion—
Expressed in terms of dispersion of test results around the arithmetic mean, usually as variance, standard deviation, repeatability
or reproducibility, or both.
3.1.11 repeatability of an analyzer, n—difference between two successive analyzer results measured in a short time interval that
would be exceeded in the long run in only 1 case in 20 (5 % of the time) when the analyzer is operated on a flowing sample of
uniform quality.
3.1.12 reproducibility of an analyzer, n—difference between a single result from each of two identical analyzer systems that
would be exceeded in the long run in only 1 case in 20 (5 % of the time) when the two systems are operated at different sites by
different operators, but on identical samples.
3.1.13 rule violation, n—condition when a point value or pattern of points in a statistical process control chart statistically
exceeds the defined probability of its occurrence, as defined by the Western Electric rules (2) being used.
3.1.14 spot sample, n—representative material resembling the stream being monitored, an identical portion of which is analyzed
both in a process analyzer and by a laboratory test on a non-scheduled basis for periodic validation testing.
3.1.14.1 Discussion—
May be the same material as the control sample.
3.1.15 validation of an analyzer, n—process to identify how comparable an analyzer’s results are statistically to results from the
primary method, or to define how the analyzer’s results compare to the primary method’s results in precision and accuracy.
3.1.15.1 Discussion—
Must be done when the analyzer is first configured or reconfigured (initial validation), and then on a periodic basis (periodic
validation), as described in Practice D3764.
D6621 − 00 (2017)
3.2 For additional definitions, see Appendix X1.
4. Summary of Practice
4.1 This practice standardizes aromatic hydrocarbon process-analyzer performance testing practices, or processes for
maintaining accurate and precise analyzer measurements. It is used with methods for the measurement and certification of aromatic
hydrocarbon materials applied to continuous on-line analyzers. These methods are generally under the control of Committee D16
on Aromatic Hydrocarbons Aromatic, Industrial, Specialty and Related Chemicals. It is meant as a practical guide for persons
setting up and maintaining these analyzers in a process (non-laboratory) environment. They should apply it, with their knowledge
of the analyzer’s operation and of how the process analyzer results are to be used, to maintain and optimize analyzer operation.
5. Significance and Use
5.1 Performance testing of on-line analyzers is critical to their proper performance within predictable levels of precision and
accuracy. This practice can affect production efficiency and certification of aromatic hydrocarbon materials.
6. System Components
6.1 Process analyzers (Fig. 1) for measuring the chemical composition of aromatic hydrocarbons, their purity, or physical
properties often replace existing laboratory test methods, using the same or similar chemical measurement techniques. Fig. 1shows
several possible analyzer configurations for on-line process testing of aromatic hydrocarbon materials. Aromatic hydrocarbon
stream analyzers are often based on chromatography, but they may also perform physical measurements, wet chemistry, or other
methods described in new or existing Committee D16 methods. This practice is intended to be generally applicable to any of them.
7. Performance Guidelines Before Calibration
7.1 At startup, validate any process analyzer against an existing analytical method, typically in this case, one overseen by
Committee D16.
7.2 The capability measurement (c ) for a given analyzer (3) shall be less than 0.2, as defined in Eq 1:
m
2 2
c 5 σ /σ ,0.2 (1)
m a p
where:
σ = standard deviation of the analyzer measurement, and
a
σ = standard deviation of the process.
p
FIG. 1 Possible Process Analyzer Configurations
D6621 − 00 (2017)
The variance (standard deviation squared) of the analyzer should be less than 20 % of the variance of the process, so that the
analyzer measurement can be useful for detecting changes in the process. The expected capability for a process analyzer
measurement may be available from the vendor for a specific application before installation of the analyzer (advertised analyzer
capability). Actual process stream measurement capability should be measured on the process/product stream, usually after initial
analyzer validation.
7.3 Automated analyzer sampling practices for aromatic hydrocarbon liquid streams shall follow those referenced in Practice
D4177.
7.4 Determine the linearity of the process analyzer by using at least three calibration standard materials with known
compositions/responses for the components of interest. Each component should be present at a high, low, and medium
concentration/amount level with respect to the concentration/amount range expected for the parameter (analyzer operating range).
A plot of the component concentration/amount versus analyzer response will determine if the analyzer has a linear response over
the concentration range of interest. If analyzer response is nonlinear, additional calibration standards must be analyzed to clearly
determine the nonlinear behavior of each analyzer and component, if the analyzer is to be used in the nonlinear range.
7.5 If a process analyzer is to be used only for trend information, the data generated by it is in a form that does not impart
compositional information, but relative information only, that is, peak area, peak height, counts, millivolts, etc. Initial validation
and frequent performance testing are still required to define precision, as well as to maintain proper analyzer operation.
8. Performance Test Procedure
8.1 Determine analyzer performance using external check samples, which are substituted for the process material stream during
performance test runs.
8.2 Process analyzers are routinely performance tested by using control samples. These may be primary or secondary standard
materials, or actual portions from the process stream. These portions must be representative of normal process conditions, and be
stored to remain physically and chemically stable over time. The control sample should be repeatedly analyzed by the process
analyzer, and then using statistical process control (SPC), to define the actual analyzer result’s precision.
8.3 Analyzer performance test frequency can be done at a fixed time interval, based on analyzer reliability and operator
experience. Typically, once per shift, day, or week are used, but it may be more or less frequent. Unscheduled control sample
analyses may be performed whenever the unit operator feels that something has changed in the process or process analyzer, or at
a convenient time.
8.4 The control sample material container shall be located at a point in the process to allow for its simple and regular
introduction into the process analyzer’s sample introduction system (if appropriate) by the process operator. A sufficient quantity
must be available for many repetitive analyses.
8.5 Perform an external analyzer performance test by switching the analyzer sample source from the process stream to the
control sample, followed by sampling and analysis of the control sample.
8.6 Monitor the analyzer’s output from the control sample until it stabilizes, that is, the difference between successive readings
is at or below the repeatability of the analyzer, (which is measured as described in 8.10). If this does not occur, the repeatability
of the analyzer has changed and should be remeasured.
8.7 After stabilization of the analyzer, measure at least three successive results on the control sample and average the results.
Plot the average of these three results in a SPC chart using any statistically correct method of data handling and control chart
construction (4).
8.8 SPC charts of the control sample data shall be used to help decide if the analyzer needs to have its response parameters reset,
(5) or if it is working within previous statistical levels and should be left alone. SPC results and operator experience should be used
to dete
...
Questions, Comments and Discussion
Ask us and Technical Secretary will try to provide an answer. You can facilitate discussion about the standard in here.