


prEN 12896-8
(Main)Public transport - Reference data model - Part 8: Management information & statistics
General Information
- Abstract
Transmodel is composed of 10 parts (see above).
This work item consists in the revision and update of the documentation of the Public transport reference data model – Part 8 (Transmodel – Part 8). The update consists basically of the following types of actions:
a. Simplication of Part 8 based on the revision of Part 1: several functional extensions of Transmodel took place since the last publication of EN12896 (in 2016 and 2019). The functional extensions elaborated until 2019 generated additional common concepts which have already been published in the relevant documents. These additional common concepts are now integrated into Transmodel - Part 1 and thus removed from Part 8.
b. Updates/extensions of Part 8 as a consequence of
• Work presented in TR17370:2019.
This TR provides a list of KPIs calculated using operational raw data.
The action consists here to provide data model extracts, representing the raw data needed for several KPIs (listed in TR17370:2019), The extracted sub-models are based upon the (already existing) "Loggable object model" and will complete the 2 examples published in the current version of Part 8.
c. Ensuring coherence of the Transmodel eco-system. Several updates of Transmodel- Part 8 result from the discussions lead with the OpRa group and intend to ensure coherence with the OpRa Technical Specification.
- Status
- Not Published
- Publication Date
- 06-Jan-2027
- Technical Committee
- CEN/TC 278 - Road transport and traffic telematics
- Drafting Committee
- CEN/TC 278/WG 3 - Public transport (PT)
- Current Stage
- 4020 - Submission to enquiry - Enquiry
- Start Date
- 04-Jun-2026
- Due Date
- 04-Dec-2025
- Completion Date
- 04-Jun-2026

Overview
prEN 12896-8: Public Transport – Reference Data Model – Part 8: Management Information & Statistics is a draft European standard developed by CEN/TC 278 (Intelligent Transport Systems). It forms part of the Transmodel series (EN 12896), which provides a comprehensive framework for the harmonised exchange, analysis, and management of public transport data across Europe. Part 8 specifically focuses on the data models and concepts required for effective management information systems and statistical analysis within the public transport sector.
This part has been revised and updated to:
- Integrate functional extensions and common concepts from previous updates to Transmodel
- Align with additional key performance indicators (KPIs) introduced in Technical Report TR17370:2019
- Ensure coherence with OpRa (Operating Raw Data and statistics exchange) Technical Specifications
Key Topics
1. Management Information & Statistics Domain
- Focuses on functions for analysing operational data (e.g., observed passing times, passenger loads, service delays, cancellations) to evaluate and improve public transport service quality.
- Encompasses three main types of data:
- Planned data (e.g., timetables, target passing times)
- Actual operational data (e.g., real-time journey details, observed passenger numbers)
- Aggregated data & calculated statistics (e.g., number/percentage of late and cancelled journeys)
2. Data Preparedness Levels
- Standardises definitions for raw, cleansed, and processed data, including metadata describing data reliability and processing state.
- Raw: Unchecked, unprocessed data direct from source
- Cleansed: Erroneous values removed
- Processed: Data values corrected as required after aggregation
3. KPIs and Data Model Extracts
- Provides extracts from the data model representing the raw data needed for calculating KPIs defined in TR17370:2019.
- Supports calculation and exchange of metrics such as punctuality, service intensity, vehicle availability, passenger numbers, and capacity.
4. Loggable Object Model
- Enables comprehensive tracking and association of operational events (e.g., journey status, passing times, boarding and alighting counts, disturbances) for later analysis.
- Facilitates logging and traceability critical for performance monitoring, reporting, and regulatory compliance.
Applications
prEN 12896-8 supports a broad range of public transport stakeholders, including operators, transit authorities, and system integrators, through:
- Performance Monitoring: Enables collection, storage, and exchange of accurate operational data to assess punctuality, reliability, and capacity utilization.
- Service Quality Analysis: Facilitates reporting processes, allowing authorities and operators to track and improve service delivery and customer experience.
- Decision Support: Provides data structures for analysing operational trends, informing planning, resource allocation, and real-time management decisions.
- Regulatory Reporting and Compliance: Establishes data consistency across systems, supporting coherent data exchanges with authorities and alignment with European standards.
- System Integration: Serves as a foundation for integrating with other ITS and public transport standards (e.g., SIRI for real-time information, NeTEx for network and timetable exchange).
Related Standards
prEN 12896-8 is part of the wider Transmodel framework and interacts with several related standards and specifications:
- EN 12896-1: Public transport - Reference data model - Part 1: Common concepts
- EN 12896-2 to -7, -10: Covering network, timing information, operations, fare management, passenger information, driver management, and alternative modes
- CEN/TS 16614 (NeTEx): Network and timetable data exchange for passenger information and accessibility
- EN 15531 (SIRI): Service interfaces for real-time public transport operations
- CEN/TS 17118 (OJP): Open API for distributed journey planning
- OpRa Technical Specification: Standard for exchange of operating raw data and statistics between public transport actors
Implementing prEN 12896-8 ensures that public transport management and reporting systems remain interoperable, data-driven, and future-ready, paving the way for improved passenger service and strategic operational planning.
Relations
- Effective Date
- 30-Apr-2025
Get Certified
Connect with accredited certification bodies for this standard

BSI Group
BSI (British Standards Institution) is the business standards company that helps organizations make excellence a habit.

NYCE
Mexican standards and certification body.
Sponsored listings
Frequently Asked Questions
prEN 12896-8 is a draft published by the European Committee for Standardization (CEN). Its full title is "Public transport - Reference data model - Part 8: Management information & statistics". This standard covers: Transmodel is composed of 10 parts (see above). This work item consists in the revision and update of the documentation of the Public transport reference data model – Part 8 (Transmodel – Part 8). The update consists basically of the following types of actions: a. Simplication of Part 8 based on the revision of Part 1: several functional extensions of Transmodel took place since the last publication of EN12896 (in 2016 and 2019). The functional extensions elaborated until 2019 generated additional common concepts which have already been published in the relevant documents. These additional common concepts are now integrated into Transmodel - Part 1 and thus removed from Part 8. b. Updates/extensions of Part 8 as a consequence of • Work presented in TR17370:2019. This TR provides a list of KPIs calculated using operational raw data. The action consists here to provide data model extracts, representing the raw data needed for several KPIs (listed in TR17370:2019), The extracted sub-models are based upon the (already existing) "Loggable object model" and will complete the 2 examples published in the current version of Part 8. c. Ensuring coherence of the Transmodel eco-system. Several updates of Transmodel- Part 8 result from the discussions lead with the OpRa group and intend to ensure coherence with the OpRa Technical Specification.
Transmodel is composed of 10 parts (see above). This work item consists in the revision and update of the documentation of the Public transport reference data model – Part 8 (Transmodel – Part 8). The update consists basically of the following types of actions: a. Simplication of Part 8 based on the revision of Part 1: several functional extensions of Transmodel took place since the last publication of EN12896 (in 2016 and 2019). The functional extensions elaborated until 2019 generated additional common concepts which have already been published in the relevant documents. These additional common concepts are now integrated into Transmodel - Part 1 and thus removed from Part 8. b. Updates/extensions of Part 8 as a consequence of • Work presented in TR17370:2019. This TR provides a list of KPIs calculated using operational raw data. The action consists here to provide data model extracts, representing the raw data needed for several KPIs (listed in TR17370:2019), The extracted sub-models are based upon the (already existing) "Loggable object model" and will complete the 2 examples published in the current version of Part 8. c. Ensuring coherence of the Transmodel eco-system. Several updates of Transmodel- Part 8 result from the discussions lead with the OpRa group and intend to ensure coherence with the OpRa Technical Specification.
prEN 12896-8 is classified under the following ICS (International Classification for Standards) categories: 35.240.60 - IT applications in transport. The ICS classification helps identify the subject area and facilitates finding related standards.
prEN 12896-8 has the following relationships with other standards: It is inter standard links to EN 12896-8:2019. Understanding these relationships helps ensure you are using the most current and applicable version of the standard.
prEN 12896-8 is associated with the following European legislation: EU Directives/Regulations: 2010/40/EU. When a standard is cited in the Official Journal of the European Union, products manufactured in conformity with it benefit from a presumption of conformity with the essential requirements of the corresponding EU directive or regulation.
prEN 12896-8 is available in PDF format for immediate download after purchase. The document can be added to your cart and obtained through the secure checkout process. Digital delivery ensures instant access to the complete standard document.
Standards Content (Sample)
SLOVENSKI STANDARD
01-september-2026
Javni prevoz - Referenčni podatkovni model - 8. del: Informacije o upravljanju in
statistika
Public transport - Reference data model - Part 8: Management information & statistics
Öffentlicher Verkehr - Referenzdatenmodell - Teil 8: Managementinformationen und
Statistiken
Transports publics - Modèle de données de référence - Partie 8 : tableaux de bord et
statistiques
Ta slovenski standard je istoveten z: prEN 12896-8
ICS:
35.240.60 Uporabniške rešitve IT v IT applications in transport
prometu
2003-01.Slovenski inštitut za standardizacijo. Razmnoževanje celote ali delov tega standarda ni dovoljeno.
DRAFT
EUROPEAN STANDARD
NORME EUROPÉENNE
EUROPÄISCHE NORM
June 2026
ICS Will supersede EN 12896-8:2019
English Version
Public transport - Reference data model - Part 8:
Management information & statistics
Transports publics - Modèle de données de référence - Öffentlicher Verkehr - Referenzdatenmodell - Teil 8:
Partie 8 : tableaux de bord et statistiques Managementinformationen und Statistiken
This draft European Standard is submitted to CEN members for enquiry. It has been drawn up by the Technical Committee
CEN/TC 278.
If this draft becomes a European Standard, CEN members are bound to comply with the CEN/CENELEC Internal Regulations
which stipulate the conditions for giving this European Standard the status of a national standard without any alteration.
This draft European Standard was established by CEN in three official versions (English, French, German). A version in any other
language made by translation under the responsibility of a CEN member into its own language and notified to the CEN-CENELEC
Management Centre has the same status as the official versions.
CEN members are the national standards bodies of Austria, Belgium, Bulgaria, Croatia, Cyprus, Czech Republic, Denmark, Estonia,
Finland, France, Germany, Greece, Hungary, Iceland, Ireland, Italy, Latvia, Lithuania, Luxembourg, Malta, Netherlands, Norway,
Poland, Portugal, Republic of North Macedonia, Romania, Serbia, Slovakia, Slovenia, Spain, Sweden, Switzerland, Türkiye and
United Kingdom.
Recipients of this draft are invited to submit, with their comments, notification of any relevant patent rights of which they are
aware and to provide supporting documentation.
Warning : This document is not a European Standard. It is distributed for review and comments. It is subject to change without
notice and shall not be referred to as a European Standard.
EUROPEAN COMMITTEE FOR STANDARDIZATION
COMITÉ EUROPÉEN DE NORMALISATION
EUROPÄISCHES KOMITEE FÜR NORMUNG
CEN-CENELEC Management Centre: Rue de la Science 23, B-1040 Brussels
© 2026 CEN All rights of exploitation in any form and by any means reserved Ref. No. prEN 12896-8:2026 E
worldwide for CEN national Members.
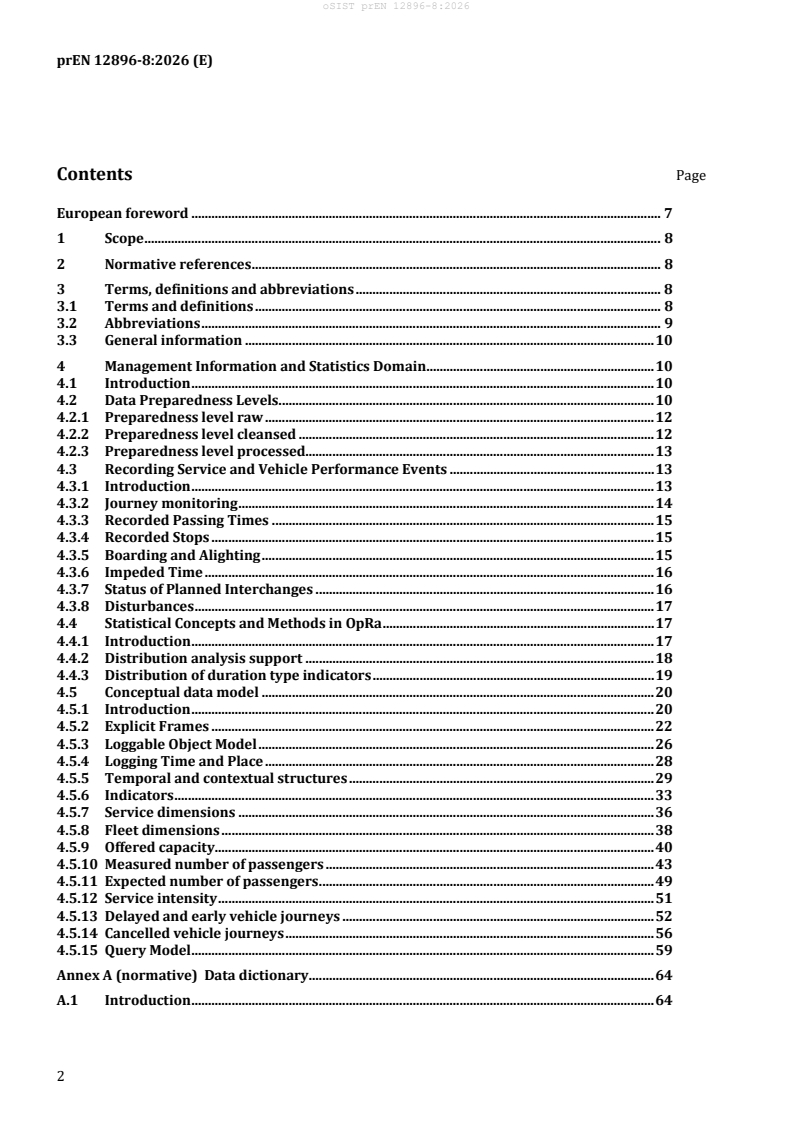
Contents Page
European foreword . 7
1 Scope . 8
2 Normative references . 8
3 Terms, definitions and abbreviations . 8
3.1 Terms and definitions . 8
3.2 Abbreviations . 9
3.3 General information . 10
4 Management Information and Statistics Domain . 10
4.1 Introduction . 10
4.2 Data Preparedness Levels. 10
4.2.1 Preparedness level raw . 12
4.2.2 Preparedness level cleansed . 12
4.2.3 Preparedness level processed. 13
4.3 Recording Service and Vehicle Performance Events . 13
4.3.1 Introduction . 13
4.3.2 Journey monitoring . 14
4.3.3 Recorded Passing Times . 15
4.3.4 Recorded Stops . 15
4.3.5 Boarding and Alighting . 15
4.3.6 Impeded Time . 16
4.3.7 Status of Planned Interchanges . 16
4.3.8 Disturbances . 17
4.4 Statistical Concepts and Methods in OpRa . 17
4.4.1 Introduction . 17
4.4.2 Distribution analysis support . 18
4.4.3 Distribution of duration type indicators . 19
4.5 Conceptual data model . 20
4.5.1 Introduction . 20
4.5.2 Explicit Frames . 22
4.5.3 Loggable Object Model . 26
4.5.4 Logging Time and Place . 28
4.5.5 Temporal and contextual structures . 29
4.5.6 Indicators . 33
4.5.7 Service dimensions . 36
4.5.8 Fleet dimensions . 38
4.5.9 Offered capacity . 40
4.5.10 Measured number of passengers . 43
4.5.11 Expected number of passengers . 49
4.5.12 Service intensity . 51
4.5.13 Delayed and early vehicle journeys . 52
4.5.14 Cancelled vehicle journeys . 56
4.5.15 Query Model . 59
Annex A (normative) Data dictionary . 64
A.1 Introduction . 64
A.2 Data dictionary — Management information and statistics . 68
A.2.1 Part 8 - Management Information & Statistics (MI) . 68
A.2.2 Part 8 - Management Information & Statistics (MI)::EF Explicit Frame MODELs . 68
A.2.3 Part 8 - Management Information & Statistics (MI)::EF Explicit Frame MODELs::AF
Actual Frame MODEL . 68
A.2.3.1 ACTUAL FRAME . 68
A.2.4 Part 8 - Management Information & Statistics (MI)::EF Explicit Frame MODELs::CI
Contextual Indicator Frame MODEL . 69
A.2.4.1 CONTEXTUAL INDICATOR . 69
A.2.4.2 CONTEXTUAL INDICATOR FRAME . 69
A.2.4.3 CONTEXT KEYLIST . 69
A.2.4.4 GENERIC CONTEXTUAL INDICATOR . 70
A.2.5 Part 8 - Management Information & Statistics (MI)::EF Explicit Frame MODELs::PF
Planned Frame MODEL . 70
A.2.5.1 PLANNED FRAME . 70
A.2.6 Part 8 - Management Information & Statistics (MI)::EF Explicit Frame MODELs::RF
Indicator Frame MODEL . 70
A.2.6.1 INDICATOR FRAME . 70
A.2.6.2 PreparednessLevel. 71
A.2.7 Part 8 - Management Information & Statistics (MI)::ID Indicator MODELs . 71
A.2.7.1 INDICATOR . 71
A.2.7.2 INDICATOR LOG ENTRY . 71
A.2.8 Part 8 - Management Information & Statistics (MI)::ID Indicator MODELs::CJ Cancelled
Dated Vehicle Journeys MODELs . 72
A.2.8.1 CANCELLED DATED VEHICLE JOURNEY COUNT . 72
A.2.8.2 CANCELLED DATED VEHICLE JOURNEY ENTRY . 72
A.2.8.3 CANCELLED JOURNEY OCCURRENCE . 73
A.2.9 Part 8 - Management Information & Statistics (MI)::ID Indicator MODELs::EX Expected
Number of Passengers MODELs . 73
A.2.9.1 EXPECTED PASSENGER COUNT . 73
A.2.9.2 EXTERNAL PASSENGER COUNT . 73
A.2.10 Part 8 - Management Information & Statistics (MI)::ID Indicator MODELs::FD Fleet
Dimensions Indicators MODELs . 74
A.2.10.1 ACTUAL FLEET DIMENSIONS . 74
A.2.10.2 FLEET DIMENSIONS . 74
A.2.10.3 PLANNED FLEET DIMENSIONS . 74
A.2.11 Part 8 - Management Information & Statistics (MI)::ID Indicator MODELs::LJ Late
Dated Vehicle Journeys MODELs . 75
A.2.11.1 LATE DATED VEHICLE JOURNEY COUNT . 75
A.2.11.2 LATE DATED VEHICLE JOURNEY ENTRY . 75
A.2.11.3 LATE JOURNEY INTERVAL . 76
A.2.11.4 LATE JOURNEY OCCURENCE CAUSE . 76
A.2.11.5 LATE JOURNEY OCCURRENCES . 76
A.2.11.6 MEAN DELAY . 77
A.2.12 Part 8 - Management Information & Statistics (MI)::ID Indicator MODELs::OC Offered
Capacity MODELs. 77
A.2.12.1 ACTUAL CAPACITY . 77
A.2.12.2 OFFERED CAPACITY . 77
A.2.12.3 CAPACITY SPECIFICATION ENUMERATION . 77
A.2.12.4 PLANNED CAPACITY . 78
A.2.12.5 Part 8 - Management Information & Statistics (MI)::ID Indicator MODELs::OC
Offered Capacity MODELs::UC Use Cases . 78
A.2.12.5.1 VEHICLE SEAT COUNT . 78
A.2.13 Part 8 - Management Information & Statistics (MI)::ID Indicator MODELs::PX
Measured Number of Passengers MODELs . 78
A.2.13.1 AGGREGATED BOARDING AND ALIGHTING ENTRY . 78
A.2.13.2 AGGREGATED ONBOARD DEVICE BASED PASSENGER COUNT . 79
A.2.13.3 AGGREGATED TICKETING BASED PASSENGER COUNT . 79
A.2.13.4 BOARDING AND ALIGHTING BASED PASSENGER COUNT . 80
A.2.13.5 ONBOARD DEVICE BASED PASSENGER COUNT . 80
A.2.13.6 TICKETING BASED PASSENGER COUNT . 80
A.2.14 Part 8 - Management Information & Statistics (MI)::ID Indicator MODELs::SD Service
Dimensions Indicator MODELs . 81
A.2.14.1 ACTUAL SERVICE DIMENSIONS . 81
A.2.14.2 PLANNED SERVICE DIMENSIONS . 81
A.2.14.3 SERVICE DIMENSIONS . 82
A.2.14.4 Part 8 - Management Information & Statistics (MI)::ID Indicator MODELs::SD
Service Dimensions Indicator MODELs::UC Use Cases . 83
A.2.15 Part 8 - Management Information & Statistics (MI)::ID Indicator MODELs::SI Service
Intensity Indicators MODELs . 83
A.2.15.1 ACTUAL SERVICE INTENSITY . 83
A.2.15.2 AVERAGE COMMERCIAL SPEED . 83
A.2.15.3 CAPACITY OVER DISTANCE . 83
A.2.15.4 EXPECTED SERVICE INTENSITY . 84
A.2.15.5 LOAD OVER JOURNEY DISTANCE . 84
A.2.15.6 MEAN CAPACITY OVER JOURNEY DISTANCE . 84
A.2.15.7 MEAN CAPACITY OVER NETWORK DISTANCE. 85
A.2.15.8 MEAN CAPACITY OVER ROUTE DISTANCE . 85
A.2.15.9 PLANNED SERVICE INTENSITY. 85
A.2.15.10 SERVICE INTENSITY . 86
A.2.15.11 TRANSPORT PERFORMANCE . 86
A.2.15.12 TRANSPORT PERFORMANCE PER VEHICLE . 86
A.2.16 Part 8 - Management Information & Statistics (MI)::RC Reusable Components MODELs
................................................................................................................................................................... 87
A.2.17 Part 8 - Management Information & Statistics (MI)::RC Reusable Components
MODELs::DM Data Managed Object MODEL . 87
A.2.17.1 DATA MANAGED OBJECT . 87
A.2.17.2 KEY LIST. 87
A.2.17.3 KEY VALUE . 87
A.2.18 Part 8 - Management Information & Statistics (MI)::RC Reusable Components
MODELs::FS Filtering Supoort MODELs . 88
A.2.18.1 CALENDAR AWARE PT SCOPE . 88
A.2.18.2 FLEET SCOPE . 88
A.2.19 Part 8 - Management Information & Statistics (MI)::RC Reusable Components
MODELs::GA Generic Aggregations MODELs . 88
A.2.19.1 DURATION DISTRIBUTION . 88
A.2.19.2 DURATION INTERVAL . 89
A.2.19.3 OCCURRENCE . 89
A.2.20 Part 8 - Management Information & Statistics (MI)::RC Reusable Components
MODELs::RT Recorded Trip MODEL . 90
A.2.20.1 RECORDED LEG . 90
A.2.20.2 RECORDED TRIP . 90
A.2.21 Part 8 - Management Information & Statistics (MI)::RC Reusable Components
MODELs::LT Logging Time and Place MODEL . 90
A.2.21.1 LOCATED EVENT . 90
A.2.22 Part 8 - Management Information & Statistics (MI)::RC Reusable Components
MODELs::RV Recorded Vehicle MODELs . 91
A.2.22.1 RECORDED STOP . 91
A.2.22.2 BOARDING AND ALIGHTING . 91
A.2.22.3 INTERCHANGE STATUS . 92
A.2.23 Part 8 - Management Information & Statistics (MI)::QM Query MODEL . 92
A.2.23.1 OPRA FUNCTIONAL REQUEST . 92
A.2.23.2 OPRA FUNCTIONAL DELIVERY . 92
A.2.23.3 GROUPING INSTRUCTION . 93
A.2.23.4 PARTICIPANT SYSTEM . 93
A.2.23.5 AGGREGATE FUNCTION . 93
A.2.23.6 AGGREGATION INSTRUCTIONS . 94
Annex B (informative) Data Model Evolutions . 95
B.1 Introduction . 95
B.2 Diagrams with additional concepts and relationships with other Parts . 95
Table B.1 — List of diagrams with additional concepts and relationships to other Parts . 95
B.3 Diagrams with additional relationships . 99
Annex C (informative) Significant technical changes between this document and the
previous edition . 101
Bibliography . 102
European foreword
This document (prEN 12896-8:2026) has been prepared by Technical Committee CEN/TC 278
“Intelligent transport systems”, the secretariat of which is held by NEN.
This document is currently submitted to the CEN Enquiry.
This document will supersede EN 12896-8:2019.
Annex C provides details of the significant technical changes between this document and EN
12896-8:2019.
This document is part of the European standard series EN 12896, known as “Transmodel”. This is a series
of documents that comprises the following parts:
— EN 12896-1, Public transport - Reference data model - Part 1: Common concepts
— EN 12896-2, Public transport - Reference data model - Part 2: Public transport network
— EN 12896-3, Public transport - Reference data model - Part 3: Timing information and vehicle
scheduling
— EN 12896-4, Public transport - Reference data model - Part 4: Operations monitoring and control
— EN 12896-5, Public transport - Reference data model - Part 5: Fare management
— EN 12896-6, Public transport - Reference data model - Part 6: Passenger information
— EN 12896-7, Public transport - Reference data model - Part 7: Driver management
— EN 12896-8, Public transport - Reference data model - Part 8: Management information and
statistics
— EN 12896-10, Public transport - Reference data model - Part 10: Alternative Modes
Together these documents create Transmodel version 6.2 and thus replace Transmodel V6.0.
In addition to the nine normative parts of this series, a Technical Report (Public Transport – Reference
Data Model – Informative Documentation) was published in 2016 under the reference CEN/TR 12896-9.
It provides additional information to help those implementing projects involving the use of Transmodel.
It is intended that this Technical Report will be extended and republished as soon as all the normative
parts are revised.
For information on the conventions, methodology, and notations for conceptual modelling and the core
principles of Transmodel, refer to EN 12896-1.
1 Scope
The present document is composed of the following data packages:
— Indicators;
— Reusable components;
— Explicit frames for statistics
— Query.
This document itself is composed of the following parts:
— main document representing the conceptual foundations and corresponding data model
(normative);
— Annex A containing the data dictionary and attribute tables, i.e. the list of all the concepts
presented in the main document together with their definitions (normative);
— Annex B presenting the model evolution (informative);
— Annex C, providing details of the significant technical changes between this document and EN
12896-8:2019 (informative)
2 Normative references
The following documents are referred to in the text in such a way that some or all of their content
constitutes requirements of this document. For dated references, only the edition cited applies. For
undated references, the latest edition of the referenced document (including any amendments) applies.
EN 12896-1, Public transport - Reference data model - Part 1: Common concepts
3 Terms, definitions and abbreviations
3.1 Terms and definitions
For the purposes of this document, the terms and definitions given in EN 12896-1 and the following apply.
3.1.1
aggregation frame
data structure within which the data values are grouped and used for a formula to provide an indicator
3.1.2
indicator
set of data (calculated or measured) which may be either qualitative or quantitative that is used to
provide information on the status (may be a measure, a functional state, etc.) or the quality of a service
or a function
3.1.3
indicator type
category of a given indicator, e.g. time, length, passenger count, price, vehicle, etc.
3.1.4
indicator unit
measurement unit (e.g. metres, seconds, passengers, etc.) in which a specific indicator is measured
3.1.5
formula
method to calculate indicators that are based on other indicators or on a set of raw data
3.1.6
granularity
input for calculation processes representing the smallest unit(s) to generate output indicator(s)
3.1.7
O/D matrix
tabular structure describing data by origin/destination parameters (e.g. daily traffic volume between
zones)
3.1.8
indicator parameter type
category of a given indicator parameter, e.g. time, length, passenger count, price, vehicle, etc.
3.1.9
indicator parameter unit
measurement unit (e.g. meters, seconds, passengers, etc.) in which a specific indicator parameter is
measured
3.2 Abbreviations
API Application Programming Interface
AVM Automatic Vehicle Monitoring
AVMS Automatic Vehicle Monitoring System
GIS Geographical Information System
GPS Global Positioning System
HTTP Hypertext Transfer Protocol
IFOPT Identification of Fixed Objects in Public Transport
ISO International Standards Organization
IT Information Technology
NeTEx Network and Timetable Exchange
PT Public Transport
PTO Public Transport Operator
OJP Open API for Distributed Journey Planning
OpRa Operating Raw Data and statistics exchange
SIRI Service Interface for Real-time Information
TM Transmodel
UML Unified Modelling Language
URI Uniform Resource Identifier
URL Universal Resource Locator
VDV Verband Deutscher Verkehrsunternehmen (Germany)
WGS World Geodetic Standard
3.3 General information
The following standards are based on the Transmodel conceptual data model for public transport domain
to provide a harmonized, interoperable, and consistent approach for public transport data, service
interfaces, and journey planning across Europe:
— EN 15531 (series) [10] to [16] – Service interfaces for real-time public transport operations.
— CEN/TS 16614 (series) (NeTEx) [17] to [22] – Network and timetable data exchange, including
passenger information and accessibility.
— CEN/TS 17118 [23] – Open API for distributed journey planning.
4 Management Information and Statistics Domain
4.1 Introduction
Management information deals with functions analysing production data to evaluate the service quality
or to take corrective measures in planning and managing operations. In public transport, for instance, the
study of operational data (e.g. observed passing times, passenger load, delays and cancellations) collected
during service operations is an input for strategic planning (e.g. how and when to amend the schedules),
tactical planning (e.g. when to undertake a certain control action), quality follow-up, etc.
Management information uses therefore three main types of data:
— data resulting from the planning stages, i.e. theoretical data on the production orders (e.g.
timetables, target passing times, driver rosters, etc.);
— data describing the daily actual production (e.g. observed passing times, actual number of
passengers, number of late or cancelled journeys, etc.);
— data aggregations and calculated statistics (late journey duration intervals, number and
percentage of late and cancelled journey occurrences)
Advances in technology for data capture, exchange, storage and analysis make it possible to make these
data available in operational and management information systems for use by a broad range of
stakeholders, such as PT operators, authorities, system suppliers, and analysts. Consistent data
structures make it easier to define interoperable queries and data exchanges for specific tasks such as
performance monitoring, service quality assessment, delay and cancellation analysis, capacity and
passenger-demand evaluation, operational control, reporting to authorities, and service planning and
optimisation.
4.2 Data Preparedness Levels
Many use cases in OpRa use data sources that can have various levels of reliability. Informing the
consumer of a dataset about the reliability of the raw data and other indicators being exchanged an
important block of metadata. For example, if an onboard data aggregator device, acting as a producer,
states that the data has been fully processed and cleaned, the consumer side is not required to develop
and maintain data cleansing functionality.
To be able to calculate the metrics transferred, using OpRa will require, depending on the data about a
metric being transferred, access to the raw unprocessed data for both planned and unplanned service
operations as well as processed clean data.
For example, in the scenario where data is being exchanged between a PTO unit and a PTO server there
are three stages of preparedness of the data:
— Raw;
— Cleansed;
— Processed.
To illustrate the differences between the preparedness states, the following table (Table 1) sums the roles
of a producer and a consumer system, and lists some consequences which would trigger some
architecture planning considerations in an OpRa-using environment.
Table 1 — Data preparedness Concepts
Preparedness: Preparedness: Preparedness:
Raw Cleansed Processed
Producer / Producer states that the Producer states that Producer states that
Consumer roles data contains the whole erroneous data was validating the data
measurement, but it removed from the had been finished
may contain erroneous measurement. and shall not be
data. It is up to the Consumer may modified.
Consumer to get rid of further investigate
Consumer can use
measurement errors if errors if required,
the data without
needed but that’s not
further examination
mandatory
of quality
Consequences Consumer needs to
Producer can hide measurement equipment’s
develop data cleansing characteristics (error probabilities)
methods
Producer has larger responsibilities
Consumer may not be depending on regulatory environment
aware of measurement
Quality of the Producer system might affect
characteristics (error
overall performance, since it filters out data
probabilities) of
Consumer software can be simpler, focusing
Producer’s equipment
more on higher-level tasks
Consumer is responsible
Consumer is responsible for calculating
for calculating statistics
statistics
A sample data flow diagram (Figure 1) shows how the level of preparedness may change as data moves
between IT systems and organisations:
Figure 1 — Data preparedness stages for a PTO – PTA environment
4.2.1 Preparedness level raw
In the scenario where data is being exchanged between a PTO unit and PTO server data for the use case
Number of cancelled journeys, the following data may be needed:
— Planned service;
— Requires actual service: control actions (PARTIAL / JOURNEY CANCELLATION);
— DATED VEHICLE JOURNEY reference;
— Cancellation type (PARTIAL / full);
— Control action metadata.
This data may contain partial or unchecked data which originates from a given person on duty at a given
place.
No checking or processing of data has occurred. This data can be referred to as raw.
4.2.2 Preparedness level cleansed
Where data goes through some cross-checking before transferring, for example it may go through some
integration process combining from multiple sources (e.g. workstations).
Where there is an obvious error, or the data value is outside of expected and or allowed values this data
element may have been removed.
This data is the same as the raw data values except false data has been removed. This data can be referred
to as cleansed.
4.2.3 Preparedness level processed
Once data has been received in the PTA data warehouse by aggregating data from multiple PTOs it may
undergo processing. This processing may have corrected a value where there is an obvious error or the
data value is outside of expected and or allowed values.
This data is the same as the raw data except where false data has been corrected. This data can be referred
to as processed.
4.3 Recording Service and Vehicle Performance Events
4.3.1 Introduction
The record of events related to the performance of vehicle journeys, in particular service journeys, on
each day of their operation is an important source of information for management information. The main
information to record is the following:
— actual passing times at points along the route;
— the number of passengers boarding and alighting and the time taken to do so;
— the occurrence of impeded time;
— interchange realisation;
— the occurrence of disturbances.
The diagram below shows such recorded information that exist in Transmodel. Several use cases use the
data from the diagram.
The Recorded Object MODEL (figure 2) for vehicle monitoring demonstrates how Transmodel supports
the capture, storage, and association of operational data related to VEHICLE MONITORING. Key
functionality of the model:
— Vehicle monitoring events: the model can record monitored vehicle journeys, including their
operational context (e.g., operating day, service journey, and vehicle journey references). Each
monitored journey can be broken down into monitored legs and monitored trips, which are
linked to trip patterns and stops.
— Temporal and spatial data: the model can handle observed passing times, recorded stops, and
interchange statuses, ensuring accurate timestamps and location references (e.g., places, zones).
— Logging and traceability: all monitored activities can be logged through vehicle monitoring log
entries and trip monitoring log entries, providing traceability for auditing and performance
analysis.
— Granularity and composition: the model allows hierarchical decomposition of journeys into legs
and trips, supporting detailed monitoring at different levels of granularity.
— Integration with service data: recorded objects should reference planned data such as service
journeys, vehicle journeys, and stop points, enabling comparison between planned and actual
operations.
— Flexibility for operational adjustments: the model should accommodate real-time updates, such
as boarding and alighting events, and interchange adjustments, to reflect actual passenger and
vehicle behaviour.
However, according to user needs many other operating raw data may be recorded.
Figure 2 — Recorded Objects MODEL
4.3.2 Journey monitoring
The data for the subsequent evaluation of service journeys is collected during operations through
recording MONITORED VEHICLE JOURNEYs (as described in EN 12896-4). Such journeys are observed
actual journeys, as recognized by a monitoring system, operated on the OPERATING DAY on which the
data are collected. The term “monitoring” should be understood in a wide sense that embraces both
automated and manual survey means.
However, it is of a great importance for management information to be able to relate, as far as possible,
any such monitored journeys to the plan assigned to them, to compare the actual production performance
against the original plan. Therefore, a MONITORED VEHICLE JOURNEY will relate, in most cases, to a
DATED VEHICLE JOURNEY. The latter represents the latest valid plan assigned to the considered vehicle.
Most DATED VEHICLE JOURNEYs will be NORMAL DATED VEHICLE JOURNEYs, which means that they
are copied from a schedule designed for a DAY TYPE to be applied on the OPERATING DAY. Others are
extra DATED VEHICLE JOURNEYs, created by a CONTROL ACTION to meet a specific set of circumstances.
Any DATED VEHICLE JOURNEY may have been amended by CONTROL ACTIONs (e.g. by shortening of the
ROUTE, an added departure lag, etc.).
4.3.3 Recorded Passing Times
The passing time of a vehicle is recorded as an OBSERVED PASSING TIME. It refers to a given MONITORED
VEHICLE JOURNEY and is recorded at a particular POINT. An OBSERVED PASSING TIME is a
specialization of DATED PASSING TIME.
The POINT in question may be a SCHEDULED STOP POINT, a TIMING POINT or any other type of POINT
defined for a measurement purpose. For instance, to evaluate the influence of the traffic on a bus line,
passing times may be recorded at the entry point then at the exit point of a complex road junction.
OBSERVED PASSING TIMEs may be recorded at TIMING POINTs to check whether standard run times are
appropriate, or at a SCHEDULED STOP POINTs to check the service punctuality as a quality indicator.
If the vehicle stops at a POINT, an OBSERVED PASSING TIME may record an arrival time or a departure
time, or both; alternatively, it may record simply a passing time. If the vehicle stops, the waiting time (i.e.
the period during which the vehicle is not moving) may also be recorded.
4.3.4 Recorded Stops
It is of interest to record when a vehicle stops at a SCHEDULED STOP POINT and opens the doors to allow
passengers to board or alight. This information is useful on networks where vehicles only stop when a
passenger (onboard or waiting at the stop point) requests it to do so. The duration of the period during
which the doors are open is also of interest, as it can be used to refine the schedules or to consolidate
demand data. This duration of the period that the doors are open is often different from that of the time
the vehicle is halted at the stop.
The entity RECORDED STOP is used to describe the above information. It is referencing an OBSERVED
PASSING TIME, extending the information captured. RECORDED STOPs may only be created for a
SCHEDULED STOP POINT. Note that, when the vehicle has several doors, the DoorsOpenedTime is the
time of opening of the first door and the DoorsClosedTime is the time when the last door is closed. A
RECORDED STOP follows the LOGGABLE OBJECT design pattern (and therefore inherits from LOGGABLE
OBJECT).
4.3.5 Boarding and Alighting
During a RECORDED STOP, i.e. when a vehicle stops at a SCHEDULED STOP POINT on a service journey,
passenger movements may take place. A passenger movement can be either boarding a vehicle or
alighting from a vehicle.
The most usual practice is to record the number of alighting and boarding passengers at a defined
SCHEDULED STOP POINT. Such information may be obtained thanks to manual surveys or specific
sensors (e.g. infrared sensors, NFC scanners, or counting steps). In spite of a certain lack of accuracy, such
sensors enable the
...