

ISO 8196-2:2009
(Main)Milk — Definition and evaluation of the overall accuracy of alternative methods of milk analysis — Part 2: Calibration and quality control in the dairy laboratory
General Information
- Abstract
ISO 8196-2|IDF 128-2:2009 gives guidelines for the calibration of instruments and quality control procedures for milk analysis in dairy laboratories.
- Status
- Published
- Publication Date
- 30-Sep-2009
- Technical Committee
- ISO/TC 34/SC 5 - Milk and milk products
- Drafting Committee
- ISO/TC 34/SC 5 - Milk and milk products
- Current Stage
- 9093 - International Standard confirmed
- Start Date
- 12-Dec-2023
- Completion Date
- 29-Aug-2026
Buy Documents
ISO 8196-2:2009 - Milk — Definition and evaluation of the overall accuracy of alternative methods of milk analysis — Part 2: Calibration and quality control in the dairy laboratory Released:10/1/2009
ISO 8196-2:2009 - Lait — Définition et évaluation de la précision globale des méthodes alternatives d'analyse du lait — Partie 2: Calibrage et contrôle qualité dans les laboratoires laitiers Released:10/1/2009
ISO 8196-2:2009 - Milk — Definition and evaluation of the overall accuracy of alternative methods of milk analysis — Part 2: Calibration and quality control in the dairy laboratory Released:4/24/2012
Overview
ISO 8196-2:2009 (IDF 128-2:2009) - Milk: Calibration and quality control in the dairy laboratory - provides practical guidance for the calibration, standardization and routine quality control of instruments used for milk analysis. It focuses on ensuring the overall accuracy of alternative methods of milk analysis, with special emphasis on rapid physicochemical techniques widely used for compositional testing in dairy laboratories.
Key topics and requirements
- Calibration vs. standardization: clear definitions and recommended experimental approaches to evaluate and adjust instrument calibration against reference methods, standard materials or a standard instrument.
- Linear relationship assumption: guidance assumes a linear relationship between alternative and reference methods and recommends an ordinary least-squares (OLS) linear regression model for calibration and prediction.
- Preliminary instrument checks: functional checks, zeroing, and manufacturer-specified adjustments before analysis.
- Linearity and interference checks: procedures to verify linear response across the component concentration range and to check instrumental compensations for interfering components.
- Repeatability and accuracy: verification methods and recommendations so instruments meet the performance characteristics defined in ISO 8196-1.
- Quality control procedures for routine labs: daily stability checks, repeatability verification, bias checks between laboratories, comparison of alternative versus reference method results, and compliance verification with compositional requirements.
- Calibration control and frequency: guidance on how often calibration should be checked and options for centralized calibration management.
- Worked examples and calculations: statistical examples for determining repeatability, calibration exactness, accuracy and compliance assessments.
Practical applications
- Ensures reliable compositional testing of milk (fat, protein, solids, etc.) using rapid alternative methods.
- Supports method validation and ongoing quality assurance in dairy laboratories.
- Provides a basis for establishing instrument acceptance criteria, control charts and laboratory SOPs.
- Helps laboratories demonstrate equivalence to a reference method for regulatory compliance and commercial testing.
- Useful for instrument manufacturers, third‑party calibration providers and centralized laboratory services planning calibration strategies.
Who should use this standard
- Dairy laboratory managers and analysts performing routine milk composition testing
- Quality assurance and regulatory compliance officers in the dairy industry
- Method validation teams and inter-laboratory study organizers
- Instrument manufacturers and service engineers responsible for calibration and maintenance
Related standards
- ISO 8196-1|IDF 128-1:2009 - Analytical attributes of alternative methods
- ISO 8196-3|IDF 128-3:2009 - Protocol for evaluation and validation of quantitative methods
Keywords: ISO 8196-2:2009, milk analysis, dairy laboratory calibration, quality control, alternative methods, OLS regression, repeatability, method validation.
Relations
- Effective Date
- 15-Apr-2008
Buy Documents
ISO 8196-2:2009 - Milk — Definition and evaluation of the overall accuracy of alternative methods of milk analysis — Part 2: Calibration and quality control in the dairy laboratory Released:10/1/2009
ISO 8196-2:2009 - Lait — Définition et évaluation de la précision globale des méthodes alternatives d'analyse du lait — Partie 2: Calibrage et contrôle qualité dans les laboratoires laitiers Released:10/1/2009
ISO 8196-2:2009 - Milk — Definition and evaluation of the overall accuracy of alternative methods of milk analysis — Part 2: Calibration and quality control in the dairy laboratory Released:4/24/2012
Get Certified
Connect with accredited certification bodies for this standard

BSI Group
BSI (British Standards Institution) is the business standards company that helps organizations make excellence a habit.

Bureau Veritas
Bureau Veritas is a world leader in laboratory testing, inspection and certification services.

DNV
DNV is an independent assurance and risk management provider.
Sponsored listings
Frequently Asked Questions
ISO 8196-2:2009 is a standard published by the International Organization for Standardization (ISO). Its full title is "Milk — Definition and evaluation of the overall accuracy of alternative methods of milk analysis — Part 2: Calibration and quality control in the dairy laboratory". This standard covers: ISO 8196-2|IDF 128-2:2009 gives guidelines for the calibration of instruments and quality control procedures for milk analysis in dairy laboratories.
ISO 8196-2|IDF 128-2:2009 gives guidelines for the calibration of instruments and quality control procedures for milk analysis in dairy laboratories.
ISO 8196-2:2009 is classified under the following ICS (International Classification for Standards) categories: 67.100.10 - Milk and processed milk products. The ICS classification helps identify the subject area and facilitates finding related standards.
ISO 8196-2:2009 has the following relationships with other standards: It is inter standard links to ISO 8196-2:2000. Understanding these relationships helps ensure you are using the most current and applicable version of the standard.
ISO 8196-2:2009 is available in PDF format for immediate download after purchase. The document can be added to your cart and obtained through the secure checkout process. Digital delivery ensures instant access to the complete standard document.
Standards Content (Sample)
INTERNATIONAL ISO
STANDARD 8196-2
IDF
128-2
Second edition
2009-10-01
Milk — Definition and evaluation of the
overall accuracy of alternative methods
of milk analysis —
Part 2:
Calibration and quality control
in the dairy laboratory
Lait — Définition et évaluation de la précision globale des méthodes
alternatives d'analyse du lait —
Partie 2: Calibrage et contrôle qualité dans les laboratoires laitiers
Reference numbers
IDF 128-2:2009(E)
©
ISO and IDF 2009
IDF 128-2:2009(E)
PDF disclaimer
This PDF file may contain embedded typefaces. In accordance with Adobe's licensing policy, this file may be printed or viewed but
shall not be edited unless the typefaces which are embedded are licensed to and installed on the computer performing the editing. In
downloading this file, parties accept therein the responsibility of not infringing Adobe's licensing policy. Neither the ISO Central
Secretariat nor the IDF accepts any liability in this area.
Adobe is a trademark of Adobe Systems Incorporated.
Details of the software products used to create this PDF file can be found in the General Info relative to the file; the PDF-creation
parameters were optimized for printing. Every care has been taken to ensure that the file is suitable for use by ISO member bodies
and IDF national committees. In the unlikely event that a problem relating to it is found, please inform the ISO Central Secretariat at the
address given below.
© ISO and IDF 2009
All rights reserved. Unless otherwise specified, no part of this publication may be reproduced or utilized in any form or by any means,
electronic or mechanical, including photocopying and microfilm, without permission in writing from either ISO or IDF at the respective
address below.
ISO copyright office International Dairy Federation
Case postale 56 • CH-1211 Geneva 20 Diamant Building • Boulevard Auguste Reyers 80 • B-1030 Brussels
Tel. + 41 22 749 01 11 Tel. + 32 2 733 98 88
Fax + 41 22 749 09 47 Fax + 32 2 733 04 13
E-mail copyright@iso.org E-mail info@fil-idf.org
Web www.iso.org Web www.fil-idf.org
Published in Switzerland
ii © ISO and IDF 2009 – All rights reserved
IDF 128-2:2009(E)
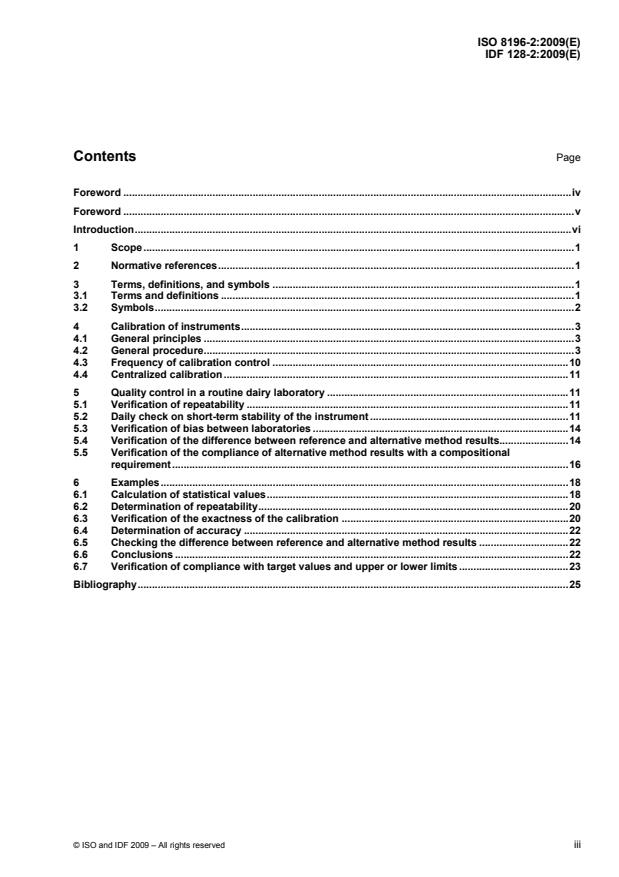
Contents Page
Foreword .iv
Foreword .v
Introduction.vi
1 Scope.1
2 Normative references.1
3 Terms, definitions, and symbols .1
3.1 Terms and definitions .1
3.2 Symbols.2
4 Calibration of instruments.3
4.1 General principles .3
4.2 General procedure.3
4.3 Frequency of calibration control .10
4.4 Centralized calibration.11
5 Quality control in a routine dairy laboratory .11
5.1 Verification of repeatability .11
5.2 Daily check on short-term stability of the instrument .11
5.3 Verification of bias between laboratories .14
5.4 Verification of the difference between reference and alternative method results.14
5.5 Verification of the compliance of alternative method results with a compositional
requirement.16
6 Examples.18
6.1 Calculation of statistical values.18
6.2 Determination of repeatability.20
6.3 Verification of the exactness of the calibration .20
6.4 Determination of accuracy .22
6.5 Checking the difference between reference and alternative method results .22
6.6 Conclusions .22
6.7 Verification of compliance with target values and upper or lower limits .23
Bibliography.25
IDF 128-2:2009(E)
Foreword
ISO (the International Organization for Standardization) is a worldwide federation of national standards
bodies (ISO member bodies). The work of preparing International Standards is normally carried out through
ISO technical committees. Each member body interested in a subject for which a technical committee has
been established has the right to be represented on that committee. International organizations, governmental
and non-governmental, in liaison with ISO, also take part in the work. ISO collaborates closely with the
International Electrotechnical Commission (IEC) on all matters of electrotechnical standardization.
International Standards are drafted in accordance with the rules given in the ISO/IEC Directives, Part 2.
The main task of technical committees is to prepare International Standards. Draft International Standards
adopted by the technical committees are circulated to the member bodies for voting. Publication as an
International Standard requires approval by at least 75 % of the member bodies casting a vote.
Attention is drawn to the possibility that some of the elements of this document may be the subject of patent
rights. ISO shall not be held responsible for identifying any or all such patent rights.
ISO 8196-2|IDF 128-2 was prepared by Technical Committee ISO/TC 34, Food products, Subcommittee SC 5,
Milk and milk products, and the International Dairy Federation (IDF). It is being published jointly by ISO and
IDF.
This second edition of ISO 8196-2|IDF 128-2 cancels and replaces the first edition (ISO 8196-2:2000), which
has been technically revised.
ISO 8196|IDF 128 consists of the following parts, under the general title Milk — Definition and evaluation of
the overall accuracy of alternative methods of milk analysis:
⎯ Part 1: Analytical attributes of alternative methods
⎯ Part 2: Calibration and quality control in the dairy laboratory
⎯ Part 3: Protocol for the evaluation and validation of alternative quantitative methods of milk analysis
iv © ISO and IDF 2009 – All rights reserved
IDF 128-2:2009(E)
Foreword
IDF (the International Dairy Federation) is a non-profit organization representing the dairy sector worldwide.
IDF membership comprises National Committees in every member country as well as regional dairy
associations having signed a formal agreement on cooperation with IDF. All members of IDF have the right to
be represented at the IDF Standing Committees carrying out the technical work. IDF collaborates with ISO in
the development of standard methods of analysis and sampling for milk and milk products.
The main task of Standing Committees is to prepare International Standards. Draft International Standards
adopted by the Action Teams and Standing Committees are circulated to the National Committees for voting.
Publication as an International Standard requires approval by at least 50 % of IDF National Committees
casting a vote.
Attention is drawn to the possibility that some of the elements of this document may be the subject of patent
rights. IDF shall not be held responsible for identifying any or all such patent rights.
ISO 8196-2|IDF 128-2 was prepared by the International Dairy Federation (IDF) and Technical Committee
ISO/TC 34, Food products, Subcommittee SC 5, Milk and milk products. It is being published jointly by ISO
and IDF.
All work was carried out by the Joint IDF-ISO Action Team on Automated methods of the Standing Committee
on Quality assurance, statistics of analytical data and sampling under the aegis of its project leader, Mr. O.
Leray (FR).
This edition of ISO 8196-2|IDF 128-2, together with ISO 8196-1|IDF 128-1 and ISO 8196-3|IDF 128-3, cancels
and replaces IDF 128:1985, which has been technically revised.
ISO 8196|IDF 128 consists of the following parts, under the general title Milk — Definition and evaluation of
the overall accuracy of alternative methods of milk analysis:
⎯ Part 1: Analytical attributes of alternative methods
⎯ Part 2: Calibration and quality control in the dairy laboratory
⎯ Part 3: Protocol for the evaluation and validation of alternative quantitative methods of milk analysis
IDF 128-2:2009(E)
Introduction
The main purpose of this part of ISO 8196|IDF 128 is to provide practical details and recommendations for the
calibration of instruments and quality control in routine dairy laboratories, including the checking of compliance
with a specification value or limit.
ISO 8196-1|IDF 128-1 is mainly intended for users to assess alternative methods of analysis and gives
guidance for routine laboratories using these methods.
This part of ISO 8196|IDF 128 relates directly to ISO 8196-1|IDF 128-1 for the definition of the relevant
performance characteristics, for the quantitative evaluation of the overall accuracy and the establishment of
relevant standard limit values to comply with in analytical quality assurance as described. The general
concepts apply to all analytical methods, but special emphasis is given to rapid physicochemical methods
which are currently in use for the compositional testing of milk.
ISO 8196|IDF 128 (all parts) only specifies the single linear regression model as a simplified approach to allow
users to determine equivalence of an alternative method with a reference method. However, the linear
regression approach is valid as a determination of method equivalence only in limited circumstances or if a
high correlation between the results of the reference method and the routine method is achieved. If a high
correlation is not achieved, recourse should be made to other data handling and measurement error modelling
techniques. Although these techniques are referred to, they are not specified in ISO 8196|IDF 128 (all parts).
vi © ISO and IDF 2009 – All rights reserved
INTERNATIONAL STANDARD
IDF 128-2:2009(E)
Milk — Definition and evaluation of the overall accuracy
of alternative methods of milk analysis —
Part 2:
Calibration and quality control in the dairy laboratory
1 Scope
This part of ISO 8196|IDF 128 gives guidelines for the calibration of instruments and quality control
procedures for milk analysis in dairy laboratories.
2 Normative references
The following referenced documents are indispensable for the application of this document. For dated
references, only the edition cited applies. For undated references, the latest edition of the referenced
document (including any amendments) applies.
ISO 8196-1|IDF 128-1:2009, Milk — Definition and evaluation of the overall accuracy of alternative methods of
milk analysis
ISO 8196-3|IDF 128-3:2009, Milk — Definition and evaluation of the overall accuracy of alternative methods of
milk analysis — Part 3: Protocol for the evaluation and validation of alternative quantitative methods of milk
analysis
3 Terms, definitions, and symbols
3.1 Terms and definitions
For the purposes of this document, the terms and definitions given in ISO 8196-1|IDF 128-1 and the following
apply.
3.1.1
standardization of an instrument
experimental evaluation of the exactness of the calibration of an instrument by reference to the true values
given either by a reference method or by standard materials or a standard instrument
3.1.2
calibration of an instrument
adjustment of the signal from an instrument so that, at each level of the component, the mean of individual
test results given by the instrument closely approximates the true value of the component concentration
IMPORTANT — Even if the term “calibration” is often used for both the standardization and calibration
of instruments (see Clause 4), the use of these words according to the definitions in 3.1.1 and 3.1.2 is
strongly recommended.
IDF 128-2:2009(E)
3.2 Symbols
b linear regression coefficient or slope
d average of differences d or mean bias
i
d difference between means of duplicates of x and y
i i i
d relative mean bias
rel
L limit of the mean bias d
d
L limit of the relative mean bias
drel
m reference value for the control chart
n number of replicates
P sum of products of x and y
xy
q number of samples
r repeatability limit
r correlation coefficient
xy
R reproducibility limit
S sum of squares of d
d
S sum of squares of x
x
S sum of squares of y
y
s standard deviation of slope
b
s standard error of estimate x
x 0
s estimate of standard deviation of y
y
s estimate of the standard deviation of accuracy
yx
t observed value of the Student t-test
obs
t t-value of the Student distribution for a two-sided probability 1 − α
1 − α/2
t t-value of the Student distribution for a one-sided probability 1 − α
1 − α
u value of the standard normal distribution for a two-sided probability 1 − α
1 − α/2
x arithmetic average of x
i
x mean of duplicates of x
i i
y arithmetic average of y
i
y mean of duplicates of y
i i
yx() predicted values from x by linear regression.
ν degree of freedom
σ standard deviation of repeatability
r
σ standard deviation of reproducibility
R
σ standard deviation of y
y
σ standard deviation of accuracy
yx
σ relative standard deviation of accuracy
yxrel
2 © ISO and IDF 2009 – All rights reserved
IDF 128-2:2009(E)
4 Calibration of instruments
4.1 General principles
This clause only considers the general principles of calibration which apply to any alternative method of milk
analysis.
Detailed and specific instructions for the calibration procedure, as well as for the preliminary checks
concerning each group of methods, shall be given in specific documentation.
The calibration here described is based on the assumption of an existing linear relationship between the
alternative method and the reference method. The utilization of an ordinary least-squares (OLS) linear
regression model with the reference method as dependent variable (y-axis) is recommended as practical and
reliable:
a) the measured residual standard deviation is structurally the lowest and is independent of the exactness of
calibration, hence it can be used for calibration control as a method accuracy characteristic (see
ISO 8196-1|IDF 128-1);
b) prediction of true values from alternative method values and calculation of associated errors is simplified;
c) the differences in measurement results as compared to applying other linear regression models are not
significant.
4.2 General procedure
4.2.1 Preliminary checks
4.2.1.1 Instrument checks: all functional checks and adjustments (zero setting) of the instrument
specified by the relevant International Standard or the manufacturer should be carried out prior to the analysis.
4.2.1.2 Linearity: unless otherwise stated, the relationship between the instrumental signal readings and
the component concentration is linear within the specified range of concentration. Normally, for alternative
methods, it is only necessary to check and adjust linearity on new instruments or whenever major parts (e.g.
cell or servo-system) are serviced or replaced.
4.2.1.3 Interference corrections (inter-corrections): where instrumental compensations for interfering
components are applied to optimize accuracy, these should be checked and eventually adjusted prior to the
analysis.
4.2.1.4 Repeatability and accuracy checks: the repeatability and accuracy of the instrument should
comply with the specifications of the relevant International Standard.
4.2.1.5 Linearity and interference corrections on a single matrix. In order to check both linearity
(4.2.1.2) and interference corrections (4.2.1.3), a set of samples can be prepared from a single milk matrix in
such a way as to cover the concentration range of a component while maintaining others constant. For
linearity, the component range relates to the measurand and the alignment of measurement results is checked
against the theoretical mixing ratio or the relevant concentration calculated from prior analyses. For
interference correction, the range concerns the interfering component, and the absence of related induced
bias for the measurand requires checking.
IDF 128-2:2009(E)
4.2.2 Standardization of the instrument
4.2.2.1 Test samples
4.2.2.1.1 General requirements
Milk samples collected especially for that purpose or, when available, standard materials with similar
characteristics may be used to standardize the instrument.
In order to obtain the most accurate estimate of the calibration line, the following two major requirements shall
be fulfilled:
a) the samples cover the whole range of concentration of the component;
b) the residual standard deviation from the regression is minimal.
Depending on the measurand, this can best be obtained by pooling individual milk samples selected at
different levels of concentration with a maximum of samples chosen for values close to the extremities of the
range or by separation and recombination of milk components or by spiking and/or aqueous dilution. Prior to
use, the equivalence of the alternative calibration samples for the component should have been validated by
comparison with usual milk samples.
4.2.2.1.2 Nature of samples
For any calibration, it is of utmost importance that calibration samples are representative of the samples
routinely tested, that is same types of milk (i.e. milk from individual animals, herd bulk milk, silo milk,
processed milk), submitted to the same treatment and preservation, and originating from the same collection
areas at the same periods of time. The period during which the calibration samples remain valid is to be
established experimentally, taking into account changes in milk production factors related to season and
regional animal feeding practices.
Discard milk of evident poor physical quality so as to guarantee homogeneous intakes and proper functioning
of the instrument (suitable milk flow).
The reference method should be applied to the fresh calibration sample, i.e. before eventually treating the
samples in the form of sub-samples.
4.2.2.1.3 Range of measurand
Samples collected should cover the whole range of concentrations for the component of interest. The larger
the range used for calibration, the more accurate the adjustment of the calibration line. In that respect, it is
recommended that the standard deviation of reference results, s , complies with Condition (1):
y
s W 5s (1)
y yx
or, equivalently, the correlation coefficient, r , complies with Condition (2)
xy
r W 0,98 (2)
xy
Alternatively, where the accuracy and/or the measurand range cannot meet the recommendation, appropriate
alternative calibration samples (4.2.2.1.1) might be considered.
NOTE Equivalent to sample pooling (4.2.2.1.1), pooling of individual data can serve to produce a suitable virtual
calibration data set where sufficient correlation cannot be achieved by physical means (see ISO 8196-3|IDF 128-3:2009,
5.2.2.2.3.2).
4 © ISO and IDF 2009 – All rights reserved
IDF 128-2:2009(E)
4.2.2.1.4 Number of samples
4.2.2.1.4.1 The number of samples depends on the objective of the laboratory, the accuracy of the
method and the heterogeneity of the sample population for the measurand.
4.2.2.1.4.2 Select the number of samples with respect to composition representativeness for main
components.
Define the number of samples needed with respect to the various origins of the test samples and the degree
of their representativeness reached by assembly. For instance, in the analysis of composition, the numbers of
representative samples recommended for use as a minimum are listed in Table 1.
Table 1 — Origin and number of representative samples
Milk type No. representative samples
Individual animal 100
Herd bulk 40
Bulk 6
Set of milk samples produced from the original bulk milk or the bulk material
Processed
used in the process, for appropriate levels of the measurand
Otherwise, a set of alternative calibration samples of equivalent representativeness prepared from at least
nine equidistant measurand concentrations over a range relevant for the commingled milk samples can be
used.
NOTE A minimum number of nine concentration levels for alternative calibration samples allows for a regular
coverage for main milk components (i.e. fat, protein and lactose) and at the same time sufficient component combinations
to check instrument fittings (linearity, interferences).
4.2.2.1.4.3 Ensure the exactness of calibration throughout the range of concentration, i.e., as specified in
4.2.2.1.4.4 and 4.2.2.1.4.5.
4.2.2.1.4.4 For the mean level, choose the minimum sample number so that any calibration bias (so-
called mean bias d) exceeding the limits ± L set by the user is statistically significant for a risk α of error.
d
From this prerequisite it follows that the limits of uncertainty of the estimated bias should not be larger than the
calibration limits stated.
From the standard deviation of accuracy, σ , estimated by s in a former evaluation (see
yx yx
ISO 8196-1|IDF 128-1 and ISO 8196-3|IDF 128-3) and the previously defined limits of calibration bias ± L ,
d
the number q should fulfil Conditions (3):
22 2
uuσσ 3,84 ×σ
1/−−αα2 yx 1 /2 yx yx
LqWW ⇔ ⇔ qW (3)
d
√ q
LL
dd
or using the limits ± L of the relative mean bias d and the relative standard deviation of accuracy σ :
rel
yxrel
drel
22 2
uσσ3,84 ×
1/−α2 yxrel yxrel
qqWW ⇔ (4)
LL
ddrel rel
where
u is the value of standard normal distribution for a probability level 1 − α;
1 − α/2
IDF 128-2:2009(E)
with
d=−xyxy=− ()x
dd=×100/y
rel
σσ=×( /y) 100
yxrel yx
α = 0,05
EXAMPLE
Fat: σ = 0,07 % mass fraction fat with L = 0,02 % mass fraction fat accepted ⇒ q W 49
yx
d
Somatic cell count: σ = 10 % with L = 3 % accepted ⇒ q W 43
yxrel
drel
4.2.2.1.4.5 For the calibration line, the limits for the relative uncertainty of slope b should not exceed the
maximum value δb defined beforehand by the user for the slope bias, so that any error in excess of this is
rel
significant. Thus, with a sample population already known with regard to σ and σ or the usual correlation
yx y
coefficient, r , the number q should fulfil Conditions (5):
xy
⎛⎞ ⎛ ⎞
σσ
yx yx
⎜⎟ ⎜ ⎟
quWW ×⇔100 q 38 400 (5)
1/−α2
22 2 2 2 2
⎜⎟ ⎜ ⎟
σσ−δbbσ−δσ
yyx rel y yx rel
⎝⎠ ⎝ ⎠
or equivalently
⎛⎞ ⎛ ⎞
11 1 1
⎜⎟ ⎜ ⎟
quWW ×−100 1 ⇔ q 38 400 − 1 (6)
1/−α2
22 2 2
⎜⎟ ⎜ ⎟
rbδδr b
xy rel xy rel
⎝⎠ ⎝ ⎠
with
δb W u σ × 100/b = u × 100 [σ /(σ √q)]
rel 1−α/2 b 1−α/2 yx y
α = 0,05
EXAMPLE
Fat: σ = 0,5 % mass fraction σ = 0,07 % mass fraction (r = 0,990 1) with a limit δb = 4 % ⇒ q W 48
y yx xy rel
Free fatty acids: σ = 0,5 mmol/100 g σ = 0,15 mol/100 g (r = 0,953 9) with a limit δb = 5 % ⇒ q W 152
y yx xy rel
4.2.2.1.5 Number of replicates
Perform sample analysis at least in duplicate.
Where the standard deviation of repeatability of the alternative method is significantly larger than the standard
deviation of repeatability of the reference method and the standard deviation of accuracy, the number of
replicates can be increased so as to get standard deviations of mean results that at minimum are equivalent
for both methods.
Thus the number of required replicates is obtained from Condition (7):
⎛⎞σ
alt
nnW (7)
⎜⎟
alt ref
σ
⎝⎠ref
6 © ISO and IDF 2009 – All rights reserved
IDF 128-2:2009(E)
where
n is the number of replicates with the reference method;
ref
n is the number of replicates with the alternative method;
alt
σ is the standard deviation of repeatability of the reference method;
ref
σ is the standard deviation of repeatability of the alternative method.
alt
By increasing the number of replicates, the residual standard deviation of the regression is reduced and the
correlation coefficient rises concurrently. When the correlation coefficient is greater than or equal to 0,98,
more replicates are not necessary. Further improvement can be obtained by increasing the number of
samples.
4.2.2.2 Statistical analysis
4.2.2.2.1 Principle
The approach presented is based on an OLS linear regression model with the underlying prerequisite of an
approximate constancy of the distribution of the residuals throughout the range of calibration. Generally, this is
the case with physicochemical methods covering no more than 1 log scale. Otherwise, transform the data so
as to equalize the residual variance throughout the range or split the range into shorter sub-ranges where
proper specific calibrations are acceptable. They should be considered separately.
x , and the reference
Prior to any calculation, plot the individual mean results of the alternative method,
i
method, y , of the q samples in an xy-axis diagram according to ISO 8196-1|IDF 128-1:2009, Figure A.1.
i
Check the distribution of the data points, which should appear linear, regular, and homogeneous.
Do not take into account samples appearing clearly out of the dot cloud, i.e. deviating significantly from the
general expected linear tendency. Consider samples lying outside the confidence belt, regression line
± 2,58 s (which constitute the limits of 99 % of the population of residuals), as suspect. For these samples,
yx
check whether their deletion significantly influences the calculated values for slope and intercept. If so, delete
them.
4.2.2.2.2 Calculation
4.2.2.2.2.1 Calculate the regression equation, yb=+x a, from data analysis, using the least-squares
ii
method, where y refers to the reference method, and x to the instrument (see ISO 8196-1|IDF 128-1).
i i
Calculate the residual standard deviation from the regression, s . That value shall be within limits of the
yx
specification given by the relevant International Standard for accuracy.
Calculate the correlation coefficient, r
xy
P
xy
r = (8)
xy
1/ 2
()SS
xy
That value should not be lower than 0,98.
Then carry out the steps in 4.2.2.2.2.2 to 4.2.2.2.2.4.
IDF 128-2:2009(E)
4.2.2.2.2.2 Test whether the slope differs statistically from 1,000 by calculating the standard deviation of b:
1/ 2
⎛⎞
s
yx
⎜⎟
s = (9)
b
⎜⎟S
x
⎝⎠
The slope is correct if in agreement with one of Expressions (10) or (11):
bt−+suu1,000 b t s (10)
1/−−αα2bb1 /2
b − 1
tt= u (11)
obs 1− α/2
s
b
[1]
where t is the value of the Student distribution (see ISO 8196-1|IDF 128-1, ISO 3534-1 and Table 2). It
shows both the random variable, t, and a particular or observed value of this variable, t .
obs
4.2.2.2.2.3 Test the null hypothesis that the regression line goes through the centre of gravity of the
sample population by calculating the standard deviation of the regression equation, yx()=+bx a, by using
Equation (12):
s
yx
s = (12)
yx()
√ q
where q is the number of samples.
The mean adjustment is correct if in agreement with one of Expressions (13) to (15):
yx()−+t s uux y()x t s (13)
1/−−αα2 yx() 1 /2 y(x)
xy−−()x t s uu0 x−y(x)+t s (14)
⎡⎤ ⎡ ⎤
⎣⎦ 1/−−αα2 yx() ⎣ ⎦ 1 /2 yx()
xy− ()x
tt= u (15)
obs 1− α / 2
s
yx()
with q − 2 degrees of freedom and α = 0,05.
Adjustment of the calibration is necessary if the slope and/or the mean bias of the regression are found to be
different from 1,000 and 0, respectively.
8 © ISO and IDF 2009 – All rights reserved
IDF 128-2:2009(E)
Table 2 — Table of critical values of Student t for a probability p and ν degrees of freedom
p
Degrees of freedom Probability
p
ν
0,90 0,950 0,975 0,99 0,995 0,999 0 0,999 5
1 3,078 6,314 12,706 31,821 63,657 318,309 636,6
2 1,886 2,920 4,303 6,965 9,925 22,327 31,60
3 1,638 2,353 3,182 4,541 5,841 10,215 12,94
4 1,533 2,132 2,776 3,747 4,604 7,173 8,610
5 1,476 2,015 2,571 3,365 4,032 5,893 6,859
6 1,440 1,943 2,447 3,143 3,707 5,208 5,959
7 1,415 1,895 2,365 2,998 3,499 4,785 5,405
8 1,397 1,860 2,306 2,896 3,355 4,501 5,041
9 1,383 1,833 2,262 2,821 3,250 4,297 4,781
10 1,372 1,812 2,228 2,764 3,169 4,144 4,587
11 1,363 1,796 2,201 2,718 3,106 4,025 4,437
12 1,356 1,782 2,179 2,681 3,055 3,930 4,318
13 1,350 1,771 2,160 2,650 3,012 3,852 4,221
14 1,345 1,761 2,145 2,624 2,977 3,787 4,140
15 1,341 1,753 2,131 2,602 2,947 3,733 4,073
16 1,337 1,746 2,120 2,583 2,921 3,686 4,015
17 1,333 1,740 2,110 2,567 2,898 3,646 3,965
18 1,330 1,734 2,101 2,552 2,878 3,610 3,922
19 1,328 1,729 2,093 2,539 2,861 3,579 3,883
20 1,325 1,725 2,086 2,528 2,845 3,552 3,850
21 1,323 1,721 2,080 2,518 2,831 3,527 3,819
22 1,321 1,717 2,074 2,508 2,819 3,505 3,792
23 1,319 1,714 2,069 2,500 2,807 3,485 3,767
24 1,318 1,711 2,064 2,492 2,797 3,467 3,745
25 1,316 1,708 2,060 2,485 2,787 3,450 3,725
26 1,315 1,706 2,056 2,479 2,779 3,435 3,707
27 1,314 1,703 2,052 2,473 2,771 3,421 3,690
28 1,313 1,701 2,048 2,467 2,763 3,408 3,674
29 1,311 1,699 2,045 2,462 2,756 3,396 3,659
30 1,310 1,697 2,042 2,457 2,750 3,385 3,
...
NORME ISO
INTERNATIONALE 8196-2
FIL
128-2
Deuxième édition
2009-10-01
Lait — Définition et évaluation
de la précision globale des méthodes
alternatives d'analyse du lait —
Partie 2:
Calibrage et contrôle qualité
dans les laboratoires laitiers
Milk — Definition and evaluation of the overall accuracy of alternative
methods of milk analysis —
Part 2: Calibration and quality control in the dairy laboratory
Numéros de référence
FIL 128-2:2009(F)
©
ISO et FIL 2009
FIL 128-2:2009(F)
PDF – Exonération de responsabilité
Le présent fichier PDF peut contenir des polices de caractères intégrées. Conformément aux conditions de licence d'Adobe, ce fichier
peut être imprimé ou visualisé, mais ne doit pas être modifié à moins que l'ordinateur employé à cet effet ne bénéficie d'une licence
autorisant l'utilisation de ces polices et que celles-ci y soient installées. Lors du téléchargement de ce fichier, les parties concernées
acceptent de fait la responsabilité de ne pas enfreindre les conditions de licence d'Adobe. Le Secrétariat central de l'ISO et la FIL
déclinent toute responsabilité en la matière.
Adobe est une marque déposée d'Adobe Systems Incorporated.
Les détails relatifs aux produits logiciels utilisés pour la création du présent fichier PDF sont disponibles dans la rubrique General Info
du fichier; les paramètres de création PDF ont été optimisés pour l'impression. Toutes les mesures ont été prises pour garantir
l'exploitation de ce fichier par les comités membres de l'ISO et les comités nationaux de la FIL. Dans le cas peu probable où
surviendrait un problème d'utilisation, veuillez en informer le Secrétariat central de l'ISO à l'adresse donnée ci-dessous.
DOCUMENT PROTÉGÉ PAR COPYRIGHT
© ISO et FIL 2009
Droits de reproduction réservés. Sauf prescription différente, aucune partie de cette publication ne peut être reproduite ni utilisée sous
quelque forme que ce soit et par aucun procédé, électronique ou mécanique, y compris la photocopie et les microfilms, sans l'accord écrit
soit de l'ISO soit de la FIL, à l'une ou l'autre des adresses ci-après.
ISO copyright office Fédération Internationale de Laiterie
Case postale 56 • CH-1211 Geneva 20 Diamant Building • Boulevard Auguste Reyers 80 • B-1030 Bruxelles
Tel. + 41 22 749 01 11 Tel. + 32 2 733 98 88
Fax + 41 22 749 09 47 Fax + 32 2 733 04 13
E-mail copyright@iso.org E-mail info@fil-idf.org
Web www.iso.org Web www.fil-idf.org
Publié en Suisse
ii © ISO et FIL 2009 – Tous droits réservés
FIL 128-2:2009(F)
Sommaire Page
Avant-propos .iv
Avant-propos .v
Introduction.vi
1 Domaine d'application .1
2 Références normatives.1
3 Termes et définitions .1
3.1 Termes et définitions .1
3.2 Symboles.2
4 Calibrage des appareils .3
4.1 Principes généraux .3
4.2 Mode opératoire général.3
4.3 Fréquence de contrôle du calibrage.10
4.4 Calibrage centralisé .11
5 Contrôle qualité en laboratoire laitier de routine .11
5.1 Contrôle de la répétabilité .11
5.2 Contrôle journalier de la stabilité à court terme de l'appareil .11
5.3 Contrôle du biais entre laboratoires.14
5.4 Contrôle de la différence entre les résultats de la méthode de référence et de la méthode
alternative.14
5.5 Contrôle de la conformité des résultats de la méthode alternative à une exigence de
composition .17
6 Exemples.19
6.1 Calcul des valeurs statistiques.19
6.2 Détermination de la répétabilité.21
6.3 Contrôle de l'exactitude du calibrage.21
6.4 Détermination de la précision .22
6.5 Contrôle de la différence entre les résultats de la méthode de référence et de la méthode
alternative.23
6.6 Conclusions .23
6.7 Vérification de la conformité avec les valeurs cibles et les limites supérieures ou
inférieures .24
Bibliographie.26
© ISO et FIL 2009 – Tous droits réservés iii
FIL 128-2:2009(F)
Avant-propos
L'ISO (Organisation internationale de normalisation) est une fédération mondiale d'organismes nationaux
de normalisation (comités membres de l'ISO). L'élaboration des Normes internationales est en général
confiée aux comités techniques de l'ISO. Chaque comité membre intéressé par une étude a le droit de faire
partie du comité technique créé à cet effet. Les organisations internationales, gouvernementales et non
gouvernementales, en liaison avec l'ISO participent également aux travaux. L'ISO collabore étroitement avec
la Commission électrotechnique internationale (CEI) en ce qui concerne la normalisation électrotechnique.
Les Normes internationales sont rédigées conformément aux règles données dans les Directives ISO/CEI,
Partie 2.
La tâche principale des comités techniques est d'élaborer les Normes internationales. Les projets de Normes
internationales adoptés par les comités techniques sont soumis aux comités membres pour vote. Leur
publication comme Normes internationales requiert l'approbation de 75 % au moins des comités membres
votants.
L'attention est appelée sur le fait que certains des éléments du présent document peuvent faire l'objet de
droits de propriété intellectuelle ou de droits analogues. L'ISO ne saurait être tenue pour responsable de ne
pas avoir identifié de tels droits de propriété et averti de leur existence.
L'ISO 8196-2⎪FIL 128-2 a été élaborée par le comité technique ISO/TC 34, Produits alimentaires,
sous-comité SC 5, Lait et produits laitiers et la Fédération Internationale de Laiterie (FIL). Elle est publiée
conjointement par l'ISO et la FIL.
Cette deuxième édition de l'ISO 8196-2⎪FIL 128-2 annule et remplace la première édition (ISO 8196-2:2000),
qui a fait l'objet d'une révision technique.
L'ISO 8196⎪FIL 128 comprend les parties suivantes, présentées sous le titre général Lait — Définition et
évaluation de la précision globale des méthodes alternatives d'analyse du lait:
⎯ Partie 1: Attributs analytiques des méthodes alternatives
⎯ Partie 2: Calibrage et contrôle qualité dans les laboratoires laitiers
⎯ Partie 3: Protocole pour l'évaluation et la validation des méthodes quantitatives alternatives d'analyse du
lait
iv © ISO et FIL 2009 – Tous droits réservés
FIL 128-2:2009(F)
Avant-propos
La FIL (Fédération Internationale de Laiterie) est une organisation sans but lucratif représentant le secteur
laitier mondial. Les membres de la FIL se composent des Comités Nationaux dans chaque pays membre et
des associations laitières régionales avec lesquelles la FIL a signé des accords de coopération. Tout membre
de la FIL a le droit de faire partie des Comités permanents de la FIL auxquels sont confiés les travaux
techniques. La FIL collabore avec l'ISO pour l'élaboration de méthodes normalisées d'analyse et
d'échantillonnage normalisées pour le lait et les produits laitiers.
La tâche principale des Comités permanents est d'élaborer les Normes internationales. Les projets de
Normes internationales adoptés par les Équipes d'Action et les Comités permanents sont soumis aux Comités
Nationaux pour vote. Leur publication comme Normes internationales requiert l'approbation de 50 % au moins
des Comités Nationaux de la FIL votants.
L'attention est appelée sur le fait que certains des éléments du présent document peuvent faire l'objet de
droits de propriété intellectuelle ou de droits analogues. La FIL ne saurait être tenue pour responsable de ne
pas avoir identifié de tels droits de propriété et averti de leur existence.
L'ISO 8196-2⎪FIL 128-2 a été élaborée par la Fédération Internationale de Laiterie (FIL) et le comité
technique ISO/TC 34, Produits alimentaires, sous-comité SC 5, Lait et produits laitiers. Elle est publiée
conjointement par la FIL et l'ISO.
L'ensemble des travaux a été confié à l'Équipe d'Action mixte ISO-FIL Méthodes automatisées du comité
permanent chargé de l'Assurance de la qualité, des statistiques des résultats d'analyse et de l'échantillonnage,
sous la conduite de son chef de projet, Mr. O. Leray (FR).
La présente édition de l'ISO 8196-2⎪FIL 128-2, conjointement à l'ISO 8196-1⎪FIL 128-1 et à
l'ISO 8196-3⎪FIL 128-3, annule et remplace la FIL 128:1985, qui a fait l'objet d'une révision technique.
L'ISO 8196⎪FIL 128 comprend les parties suivantes, présentées sous le titre général Lait — Définition et
évaluation de la précision globale des méthodes alternatives d'analyse du lait:
⎯ Partie 1: Attributs analytiques des méthodes alternatives
⎯ Partie 2: Calibrage et contrôle qualité dans les laboratoires laitiers
⎯ Partie 3: Protocole pour l'évaluation et la validation des méthodes quantitatives alternatives d'analyse du
lait
© ISO et FIL 2009 – Tous droits réservés v
FIL 128-2:2009(F)
Introduction
Le principal objectif de la présente partie de l'ISO 8196 |FIL 128 est de donner des informations pratiques et
des recommandations pour l'étalonnage des appareils et le contrôle qualité dans les laboratoires laitiers, y
compris la vérification de la conformité à une valeur ou une limite spécifiées.
L'ISO 8196-1|FIL 128-1 est principalement destinée aux spécialistes pour l'évaluation de méthodes d'analyse
alternatives, et sert de guide aux laboratoires de routine utilisant ces méthodes.
La présente partie de l'ISO 8196 |FIL 128 est directement liée à l'ISO 8196-1|FIL 128-1 pour ce qui concerne
la définition des caractéristiques de performance pertinentes pour l'évaluation quantitative de la précision
globale et la détermination de valeurs limites normalisées pertinentes à respecter pour l'assurance de la
qualité analytique telle que décrite. Le concept général s'applique à toutes les méthodes analytiques mais une
attention particulière est portée aux méthodes physicochimiques rapides qui sont couramment utilisées pour
déterminer la composition du lait.
L'ISO 8196 | FIL 128 (toutes les parties) spécifie uniquement le modèle de régression linéaire simple décrit en
tant qu'approche simplifiée permettant aux utilisateurs de déterminer l'équivalence d'une méthode alternative
avec une méthode de référence. Toutefois, l'approche par régression linéaire ne s'applique comme
détermination d'équivalence de méthode que dans des circonstances limitées ou lorsqu'il existe une forte
corrélation entre les résultats de la méthode de référence et la méthode de routine. En l'absence d'une forte
corrélation, il convient d'avoir recours à d'autres techniques de modélisation d'erreur de mesure et de
traitement de données. Bien qu'elles soient mentionnées dans certains articles, ces techniques ne sont pas
décrites dans l'ISO 8196 | FIL 128 (toutes les parties).
vi © ISO et FIL 2009 – Tous droits réservés
NORME INTERNATIONALE
FIL 128-2:2009(F)
Lait — Définition et évaluation de la précision globale
des méthodes alternatives d'analyse du lait —
Partie 2:
Calibrage et contrôle qualité dans les laboratoires laitiers
1 Domaine d'application
La présente partie de l'ISO 8196 |FIL 128 donne des directives pour l'étalonnage des appareils et les
protocoles de contrôle qualité pour l'analyse du lait dans les laboratoires laitiers.
2 Références normatives
Les documents de référence suivants sont indispensables pour l'application du présent document. Pour les
références datées, seule l'édition citée s'applique. Pour les références non datées, la dernière édition du
document de référence s'applique (y compris les éventuels amendements).
ISO 8196-1|FIL 128-1:2009, Lait — Définition et évaluation de la précision globale des méthodes alternatives
d'analyse du lait — Partie 1: Attributs analytiques des méthodes alternatives
ISO 8196-3|FIL 128-3:2009, Lait — Définition et évaluation de la précision globale des méthodes alternatives
d'analyse du lait — Partie 3: Protocole pour l'évaluation et la validation des méthodes quantitatives
alternatives d'analyse du lait
3 Termes et définitions
3.1 Termes et définitions
Pour les besoins du présent document, les termes et définitions donnés dans l'ISO 8196-1|FIL 128-1 ainsi que
les suivants s'appliquent.
3.1.1
étalonnage d'un appareil
évaluation expérimentale de l'exactitude du calibrage d'un appareil par référence aux valeurs vraies données
soit par une méthode de référence, soit par des matériaux étalons, soit par un appareil étalon
3.1.2
calibrage d'un appareil
réglage du signal d'un instrument de façon qu'à chaque niveau du constituant la moyenne des résultats
individuels donnés par l'appareil approche étroitement la valeur vraie de la concentration du constituant
IMPORTANT — Même si le terme «calibrage» est souvent utilisé aussi bien pour l'étalonnage que pour
le calibrage des appareils (voir Article 4), il est recommandé d'utiliser ces mots selon les définitions
3.1.1 et 3.1.2.
© ISO et FIL 2009 – Tous droits réservés 1
FIL 128-2:2009(F)
3.2 Symboles
b coefficient de régression linéaire ou pente
d moyenne des différences d ou biais
i
d différence entre moyennes des duplicats de x et y
i i i
d moyenne relative des biais
rel
L limite des biais moyens d
d
L limite de biais moyens
drel
m valeur de référence pour la feuille de contrôle
n nombre de répétitions
P somme des produits de x et y
xy
q nombre d'échantillons
r limite de répétabilité
r coefficient de corrélation
xy
R limite de reproductibilité
S somme des carrés de d
d
S somme des carrés de x
x
S somme des carrés de y
y
s écart-type de la pente
b
s erreur standard de l'estimation x
x 0
s estimation de l'écart-type de y
y
s estimation de l'écart-type de la précision
yx
t valeur observée par le test de Student t
obs
t valeur t de la distribution de Student pour une probabilité bilatérale 1 − α
1 − α/2
t valeur t de la distribution de Student pour une probabilité unilatérale 1 − α
1 − α
u valeur la distribution normale pour une probabilité bilatérale 1 − α
1 − α/2
x moyenne arithmétique de x
i
x moyenne des duplicats de x
i i
y moyenne arithmétique de y
i
y moyenne des duplicats de y
i i
yx() valeurs prévues à partir de x par régression linéaire
ν degré de liberté
σ écart-type de répétabilité
r
σ écart-type de reproductibilité
R
σ écart-type de y
y
σ écart-type de précision
yx
σ écart-type relatif de précision
yxrel
2 © ISO et FIL 2009 – Tous droits réservés
FIL 128-2:2009(F)
4 Calibrage des appareils
4.1 Principes généraux
Le présent article concerne seulement les principes généraux du calibrage, applicables à toute méthode
alternative d'analyse du lait.
Les instructions détaillées et spécifiques concernant les modes opératoires de calibrage ainsi que les
contrôles préliminaires seront données pour chaque groupe de méthodes dans une documentation spécifique.
Le calibrage décrit ici est fondé sur l'hypothèse de l'existence d'une relation linéaire entre la méthode
alternative et la méthode de référence. L'utilisation d'un modèle de régression linéaire des moindres carrés
ordinaire (OLS) avec la méthode de référence comme variable dépendante (axe Y) est recommandée comme
pratique et fiable:
a) l'écart-type résiduel mesuré est structurellement le plus faible et est indépendant de l'exactitude du
calibrage, il peut donc être utilisé pour le contrôle du calibrage comme une caractéristique de précision
de la méthode (voir l'ISO 8196-1|FIL 128-1);
b) la prédiction des valeurs vraies à partir des valeurs obtenues par la méthode alternative et le calcul des
erreurs associées sont simplifiés;
c) les différences de résultats de mesure par rapport à l'application d'autres modèles de régression linéaire
ne sont pas significatives.
4.2 Mode opératoire général
4.2.1 Vérifications préliminaires
4.2.1.1 Contrôles de l'appareil: il convient que tous les contrôles de fonctionnement et les réglages
(ajustement du zéro) de l'appareil spécifiés par la Norme internationale pertinente ou le constructeur soient
effectués avant l'analyse.
4.2.1.2 Linéarité: sauf indication contraire, la relation entre les lectures du signal instrumental et la
concentration du constituant est linéaire dans la gamme de concentrations spécifiée. Normalement, pour les
méthodes alternatives, seuls une vérification et un réglage de la linéarité sont nécessaires sur de nouveaux
appareils ou lorsque des parties importantes (par exemple cellule ou servo-système) sont remplacées ou font
l'objet d'opérations d'entretien.
4.2.1.3 Corrections d'interférences (inter-corrections): lorsque des compensations instrumentales des
constituants interférants sont appliquées afin d'optimiser la précision, il convient que celles-ci soient vérifiées
et ultérieurement réglées avant l'analyse.
4.2.1.4 Vérification de la répétabilité et de la précision: il convient que la répétabilité et la précision de
l'appareil répondent aux spécifications de la Norme internationale pertinente.
4.2.1.5 Linéarité et corrections d'interférences sur une seule matrice: pour vérifier aussi bien la
linéarité (4.2.1.2) et les corrections d'interférence (4.2.1.3), une série d'échantillons peut être préparée à partir
d'une seule matrice de lait de manière à couvrir la gamme de concentration d'un constituant tout en
maintenant les autres constants. Pour la linéarité, la gamme de concentration du constituant se rapporte au
mesurande et l'alignement des résultats de mesure est vérifié par rapport aux rapports de mélange théoriques
ou aux concentrations correspondantes calculées à partir d'analyses préalables. Pour la correction des
interférences, la gamme de concentration concerne le constituant interférant et il y a lieu de vérifier l'absence
de biais induits correspondants au niveau du mesurande.
© ISO et FIL 2009 – Tous droits réservés 3
FIL 128-2:2009(F)
4.2.2 Étalonnage de l'appareil
4.2.2.1 Échantillons pour essai
4.2.2.1.1 Exigences générales
Des échantillons de lait spécialement collectés à cet effet ou, si l'on en dispose, des matériaux étalons ayant
des caractéristiques similaires peuvent être utilisés pour étalonner l'appareil.
Pour obtenir l'estimation la plus précise de la droite de calibrage, les deux exigences principales suivantes
doivent être satisfaites:
a) il convient que les échantillons de lait couvrent la totalité de la gamme de concentration du constituant;
b) il convient que l'écart-type résiduel par rapport à la régression soit minimal.
Selon le mesurande, la meilleure façon de procéder peut être un regroupement d'échantillons de lait
individuels sélectionnés à différents niveaux de concentration avec un nombre maximal d'échantillons choisis
pour leurs valeurs proches des extrémités de la gamme, ou une séparation et une recombinaison des
constituants du lait, ou un ajout connu et/ou une dilution aqueuse. Avant utilisation, il convient de valider
l'équivalence entre les échantillons alternatifs de calibrage pour le constituant et des échantillons de lait
courants.
4.2.2.1.2 Nature des échantillons
Pour tout calibrage, il est de la plus haute importance que les échantillons prélevés pour le calibrage soient
représentatifs des échantillons normalement soumis à essai, c'est-à-dire qu'ils soient du même type de lait
(c'est-à-dire lait d'animaux individuels, grand mélange de laits de troupeaux, lait de silo, lait transformé)
soumis au même traitement et à la même conservation et prélevés dans les mêmes zones de collecte aux
mêmes périodes. La durée de la période de validité de l'échantillon de calibrage doit être déterminée
expérimentalement en tenant compte de la variation des facteurs de production du lait liée aux saisons et aux
pratiques régionales en matière d'alimentation des animaux.
Éliminer tout lait dont la qualité physique est manifestement médiocre, afin de garantir des prises d'essai
homogènes et un fonctionnement correct de l'appareil (débit de lait approprié).
Il convient d'appliquer la méthode de référence à des échantillons frais, c'est-à-dire avant leur traitement sous
forme de sous-échantillons.
4.2.2.1.3 Gamme du mesurande
Il convient que les échantillons collectés couvrent la totalité de la gamme de concentration du constituant
considéré. Plus la gamme utilisée pour le calibrage est étendue, plus l'ajustement de la droite de calibrage est
précis. À cet égard, il est recommandé que l'écart-type des résultats de référence, s , soit conforme à la
y
Condition (1):
s W 5s (1)
y yx
ou, de manière équivalente, que le coefficient de corrélation, r , soit conforme à la Condition (2):
xy
r W 0,98 (2)
xy
Subsidiairement, lorsque la précision et/ou la gamme du mesurande ne peuvent pas respecter la
recommandation, il est également possible d'envisager des échantillons alternatifs de calibrage appropriés
(4.2.2.1.1).
4 © ISO et FIL 2009 – Tous droits réservés
FIL 128-2:2009(F)
NOTE De manière équivalente au regroupement d'échantillons (4.2.2.1.1), le regroupement de données individuelles
peut servir à produire un ensemble de données virtuelles de calibrage approprié lorsqu'une corrélation suffisante ne peut
pas être établie par des moyens physiques (voir l'ISO 8196-3| FIL 128-3:2009, 5.2.2.2.3.2).
4.2.2.1.4 Nombre d'échantillons
4.2.2.1.4.1 Le nombre d'échantillons dépend de l'objectif du laboratoire, de la précision de la méthode et de
l'hétérogénéité de la population d'échantillons pour le mesurande.
4.2.2.1.4.2 Choisir le nombre d'échantillons par rapport à la représentativité de la composition pour les
principaux constituants.
Définir le nombre d'échantillons requis eu égard aux diverses origines des échantillons pour essai et au degré
de représentativité atteint par leur regroupement. Par exemple, dans l'analyse de la composition, le nombre
d'échantillons représentatifs recommandés pour une utilisation au minimum est donné dans le Tableau 1.
Tableau 1 — Origine et nombre d'échantillons représentatifs
Type de lait Nombre d'échantillons représentatifs
Animal individuel 100
Grand mélange de
lait de troupeaux
Grand mélange 6
Série d'échantillons de lait produits à partir du lait de grand mélange initial
Lait de
ou du matériau utilisé dans le procédé, pour des niveaux appropriés du
transformation
mesurande
Sinon, il est possible d'utiliser une série d'échantillons alternatifs de calibrage ayant une représentativité
équivalente, comprenant au moins neuf concentrations de mesurande équidistantes sur une gamme
pertinente pour les échantillons de lait mis en mélange.
NOTE Pour les échantillons alternatifs de calibrage, un nombre minimal de neuf niveaux de concentration offre une
couverture régulière pour les principaux constituants du lait (c'est-à-dire matière grasse, protéine et lactose) et
suffisamment de combinaisons de constituants pour vérifier les réglages de l'appareil (linéarité, interférences).
4.2.2.1.4.3 Assurer la précision du calibrage sur toute la gamme de concentration, comme spécifié en
4.2.2.1.4.4 et 4.2.2.1.4.5.
4.2.2.1.4.4 Pour le niveau moyen, choisir le nombre minimal d'échantillons de manière que tout biais de
calibrage (appelé biais moyen d ) dépassant les limites ± L déterminées par l'utilisateur soit statistiquement
d
significatif pour un risque α d'erreur. De cette condition préalable, il découle que les limites d'incertitude du
biais estimé ne sont généralement pas supérieures aux limites de calibrage indiquées.
À partir de l'écart-type de précision, σ , estimé par s au cours d'une évaluation précédente
yx yx
(voir l'ISO 8196-1| FIL 128-1 et l'ISO 8196-3| FIL 128-3) et des limites de biais de calibrage définies
précédemment ± L , il convient que le nombre q satisfasse aux Conditions (3):
d
22 2
uuσσ 3,84 ×σ
1/−−αα2 yx 1 /2 yx yx
LqWW ⇔ ⇔qW (3)
d
√ q
LL
dd
© ISO et FIL 2009 – Tous droits réservés 5
FIL 128-2:2009(F)
ou en utilisant les limites ± L du biais relatif moyen et d l'écart-type relatif de précision, σ :
rel
yxrel
drel
22 2
uσσ3,84 ×
1/−α2 yxrel yxrel
qqWW ⇔ (4)
LL
ddrel rel
où
u est la valeur d'une distribution normale pour un niveau de probabilité 1 − α;
1 − α/2
avec
d=−xyxy=− ()x
dd=×100/y
rel
σσ=×( /y) 100
yxrel yx
α = 0,05
EXEMPLE
Matière grasse: σ = 0,07 % en fraction massique de matière grasse
yx
avec L = 0,02 % en fraction massique de matière grasse acceptée ⇒ q W 49
d
Numération des cellules somatiques: σ = 10 % avec L =3% accepté ⇒ q W 43
yxrel d rel
4.2.2.1.4.5 Pour la droite de calibrage, il convient que les limites de l'incertitude relative de la pente, b, ne
dépassent pas la valeur maximale, δb , définie préalablement par l'utilisateur pour le biais de la pente, de
rel
manière que toute erreur supérieure soit significative. Par conséquent, avec une population d'échantillons
déjà connue pour ce qui concerne, σ et σ ou le coefficient de corrélation courant, r , il convient que le
yx y xy
nombre, q, satisfasse aux Conditions (5):
⎛⎞ ⎛ ⎞
σσ
yx yx
⎜⎟ ⎜ ⎟
quWW ×⇔100 q 38 400 (5)
1/−α2
22 2 2 2 2
⎜⎟ ⎜ ⎟
σσ−δbbσ−δσ
yyx rel y yx rel
⎝⎠ ⎝ ⎠
ou de manière équivalente
⎛⎞ ⎛ ⎞
11 1 1
⎜⎟ ⎜ ⎟
quWW ×−100 1 ⇔ q 38 400 − 1 (6)
1/−α2
22 2 2
⎜⎟ ⎜ ⎟
rbδδr b
xy rel xy rel
⎝⎠ ⎝ ⎠
avec
δb W u σ × 100/b = u × 100 [σ /(σ √q)]
rel 1−α/2 b 1−α/2 yx y
α = 0,05
EXEMPLE:
Matière grasse: σ = 0,5 % en fraction massique σ = 0,07 % en fraction massique (r = 0,990 1) avec
y yx xy
une limite δb = 4 % ⇒ q W 48.
rel
Acides gras libres σ = 0,5 mmol/100 g σ = 0,15 mol/100 g (r = 0,953 9) avec
y yx xy
une limite δb = 5 % ⇒ q W 152.
rel
6 © ISO et FIL 2009 – Tous droits réservés
FIL 128-2:2009(F)
4.2.2.1.5 Nombre de répétitions
Réaliser l'analyse des échantillons au moins en double.
Lorsque l'écart-type de répétabilité de la méthode alternative est nettement plus élevé que l'écart-type de
répétabilité de la méthode de référence et l'écart-type de précision, le nombre de répétitions peut être
augmenté de manière à obtenir des écarts-types de moyennes de répétitions au moins équivalents avec les
deux méthodes.
Dès lors le nombre de répétitions est obtenu à l'aide de la Condition (7):
⎛⎞σ
alt
nnW (7)
⎜⎟
alt ref
σ
⎝⎠ref
où
n est le nombre de répétitions avec la méthode de référence;
ref
n est le nombre de répétitions avec la méthode alternative;
alt
σ est l'écart-type de répétabilité de la méthode de référence;
ref
σ est l'écart-type de répétabilité de la méthode alternative.
alt
En augmentant le nombre de répétitions, l'écart-type résiduel de la régression est réduit et le coefficient de
corrélation augmente mécaniquement. Lorsque le coefficient de corrélation est supérieur ou égal à 0,98, il est
inutile d'augmenter le nombre de répétitions. Des améliorations supplémentaires peuvent être obtenues en
augmentant le nombre d'échantillons.
4.2.2.2 Analyse statistique
4.2.2.2.1 Principe
L'approche présentée est basée sur un modèle de régression linéaire simple par la méthode des moindres
carrés avec la condition préalable sous-jacente d'une constance approximative de la distribution résiduelle sur
toute la gamme de calibrage. C'est généralement le cas pour les méthodes physicochimiques qui ne couvrent
pas plus d'une échelle logarithmique. Sinon, transformer les données de manière à égaliser la variance
résiduelle sur toute la gamme ou fractionner la gamme en gammes secondaires plus réduites où des
calibrages spécifiques appropriés soient acceptables. Il convient de les étudier séparément.
Avant tout calcul, enregistrer sur un diagramme x-y les résultats moyens individuels de la méthode
alternative, x et de la méthode de référence, y , des q échantillons conformément à la Figure A.1 de
i i
l'ISO 8196-1 | FIL 128-1:2009. Vérifier la distribution des points qui doit apparaître linéaire, régulière et
homogène.
Ne pas tenir compte des échantillons qui apparaissent nettement en dehors du nuage de points, c'est-à-dire
qui s'écartent nettement de la tendance linéaire générale attendue. Considérer comme suspects les
échantillons situés en dehors de la bande de confiance de ± 2,58s (qui constituent les limites de 99 % de la
yx
population des résidus). Pour ces échantillons, vérifier si leur suppression influence de manière significative
les valeurs calculées pour la pente et l'ordonnée à l'origine. Si c'est le cas, les supprimer.
4.2.2.2.2 Calcul
4.2.2.2.2.1 Calculer l'équation de régression yb=+x a à partir des données analytiques, en utilisant la
ii
méthode des moindres carrés, où y se rapporte à la méthode de référence et x à l'appareil (voir
i i
l'ISO 8196-1 | FIL 128-1).
© ISO et FIL 2009 – Tous droits réservés 7
FIL 128-2:2009(F)
Calculer l'écart-type résiduel par rapport à la régression, s . Cette valeur doit être dans les limites fixées par
yx
la norme pour la précision.
Calculer le coefficient de corrélation r
xy
P
xy
r = (8)
xy
1/ 2
()SS
xy
Il convient que cette valeur ne soit pas inférieure à 0,98.
Réaliser ensuite les étapes de 4.2.2.2.2.2 à 4.2.2.2.2.4.
4.2.2.2.2.2 Vérifier si la pente diffère statistiquement de 1,000 en calculant l'écart-type de b:
1/ 2
⎛⎞
s
yx
⎜⎟
s = (9)
b
⎜⎟S
x
⎝⎠
La pente est correcte si elle est conforme à l'une des Expressions (10) ou (11):
bt−+suu1,000 b t s (10)
1/−−αα2bb1 /2
b − 1
tt= u (11)
obs 1− α/2
s
b
[1]
où t est la valeur de la distribution de Student (voir l'ISO 8196-1 | FIL 128-1, l'ISO 3534-1 et le Tableau 2).
Elle montre à la fois la variable aléatoire, t, et une valeur particulière ou observée de cette variable, t .
obs
4.2.2.2.2.3 Vérifier l'hypothèse nulle selon laquelle la droite de régression passe par le centre de gravité
de la population d'échantillons en calculant l'écart-type de l'équation de régression yx()=+bx a, en utilisant
l'Équation (12):
s
yx
s = (12)
yx()
√ q
où q est le nombre d'échantillons.
L'ajustement de la moyenne est correct s'il est effectué conformément à l'une des Expressions (13) à (15):
yx()−+t s uux y()x t s (13)
1/−−αα2 yx() 1 /2 y(x)
xy−−()x t s uu0 x−y(x)+t s (14)
⎡⎤ ⎡ ⎤
⎣⎦ 1/−−αα2 yx() ⎣ ⎦ 1 /2 yx()
xy− ()x
tt= u (15)
obs 1− α / 2
s
yx()
avec q – 2 degrés de liberté et α = 0,05.
Une correction du calibrage est nécessaire si la pente et/ou le biais moyen de la droite de régression diffèrent
respectivement de 1,000 et de zéro.
8 © ISO et FIL 2009 – Tous droits réservés
FIL 128-2:2009(F)
Tableau 2 — Tableau des valeurs critiques de Student, t , pour une probabilité p et ν degrés de libertés
p
Probabilité
Degré de liberté
p
0,90 0,950 0,975 0,99 0,995 0,999 0 0,999 5
ν
1 3,078 6,314 12,706 31,821 63,657 318,309 636,6
2 1,886 2,920 4,303 6,965 9,925 22,327 31,60
3 1,638 2,353 3,182 4,541 5,841 10,215 12,94
4 1,533 2,132 2,776 3,747 4,604 7,173 8,610
5 1,476 2,015 2,571 3,365 4,032 5,893 6,859
6 1,440 1,943 2,447 3,143 3,707 5,208 5,959
7 1,415 1,895 2,365 2,998 3,499 4,785 5,405
8 1,397 1,860 2,306 2,896 3,355 4,501 5,041
9 1,383 1,833 2,262 2,821 3,250 4,297 4,781
10 1,372 1,812 2,228 2,764 3,169 4,144 4,587
11 1,363 1,796 2,201 2,718 3,106 4,025 4,437
12 1,356 1,782 2,179 2,681 3,055 3,930 4,318
13 1,350 1,771 2,160 2,650 3,012 3,852 4,221
14 1,345 1,761 2,145 2,624 2,977 3,787 4,140
15 1,341 1,753 2,131 2,602 2,947 3,733 4,073
16 1,337 1,746 2,120 2,583 2,921 3,686 4,015
17 1,333 1,740 2,110 2,567 2,898 3,646 3,965
18 1,330 1,734 2,101 2,552 2,878 3,610 3,922
19 1,328 1,729 2,093 2,539 2,861 3,579 3,883
20 1,325 1,725 2,086 2,528 2,845 3,552 3,850
21 1,323 1,721 2,080 2,518 2,831 3,527 3,819
22 1,321 1,717 2,074 2,508 2,819 3,505 3,792
23 1,319 1,714 2,069 2,500 2,807 3,485 3,767
24 1,318 1,711 2,064 2,492 2,797 3,467 3,745
25 1,316 1,708 2,060 2,485 2,787 3,450 3,725
26 1,315 1,706 2,056 2,479 2,779 3,435 3,707
27 1,314 1,703 2,052 2,473 2,771 3,421 3,690
28 1,313 1,701 2,048 2,467 2,763 3,408 3,674
29 1,311 1,699 2,045 2,462 2,756 3,396 3,659
30 1,310 1,697 2,042 2,457 2,750 3,385 3,646
31 1,309 1,696 2,040 2,453 2,744 3,375 3,633
32 1,309 1,694 2,037 2,449 2,738 3,365 3,622
33 1,308 1,692 2,035 2,445 2,733 3,356 3,611
34 1,307 1,691 2,032 2,441 2,728 3,348 3,601
35 1,306 1,690 2,030 2,438 2,724 3,340 3,591
36 1,306 1,688 2,028 2,434 2,719 3,333 3,582
37 1,305 1,687 2,026 2,431 2,715 3,326 3,574
38 1,304 1,686 2,024 2,429 2,712 3,319 3,566
39 1,304 1,685 2,023 2,426 2,708 3,313 3,558
40 1,303 1,684 2,021 2,423 2,704 3,307 3,551
45 1,301 1,679 2,014 2,412 2,690 3,281 3,520
50 1,299 1,676 2,009 2,403 2,678 3,261 3,496
55 1,297 1,673 2,004 2,396 2,668 3,245 3,476
60 1,296 1,671 2,000 2,390 2,660 3,232 3,460
70 1,294 1,667 1,994 2,381 2,648 3,211 3,435
80 1,292 1,664 1,990 2,374 2,639 3,195 3,415
90 1,291 1,662 1,987 2,368 2,632 3,183 3,400
100 1,290 1,660 1,984 2,364 2,626 3,174 3,389
200 1,286 1,653 1,972 2,345 2,601 3,131 3,339
500 1,283 1,648 1,965 2,334 2,586 3,106 3,310
Inf (∞) 1,282 1,645 1,960 2,326 2,576 3,090 3,291
© ISO et FIL 2009 – Tous droits réservés 9
FIL 128-2:2009(F)
4.2.2.2.2.4 L'essai en 4.2.2.2.2.3 est équivalent à vérifier la moyenne des différences dx=−y ou le
iii
biais moyen d, par rapport à zéro lorsque la pente ne diffère pas statistiquement de 1,000, étant donné que
yx() =y etdx=−y=x−y()x.
Dans ce cas, l'ajustement au niveau moyen est correct lorsqu'il vérifie la Condition (16):
s s
dd
dt−+uu0 d t (16)
1/−α2 1−α/2
√√qq
avec q – 1 degré de liberté et α = 0,05.
Si les deux essais (ajustement de la pente et de la moyenne) sont négatifs, l'ordonnée à l'origine ne diffère
pas statistiquement de zéro selon l'une des Équations (17) ou (18):
at−+suu0 a t s
1/−−αα2aa1 /2 (17)
a
tt= u
obs 1− α / 2 (18)
s
a
avec
1/ 2
⎛⎞
1 x
ss=+ ⎜⎟ (19)
ayx
⎜⎟
qS
x
⎝⎠
4.2.3 Calibrage de l'appareil
Ajuster la pente et l'ordonnée à l'origine de la droite de calibrage de façon à faire coïncider la droite de
calibrage observée avec la droite théorique. Pour effectuer un bon calibrage, suivre les instructions du
fabricant et la norme spécifique.
Dans tous les cas, une fois le réglage final effectué, contrôler avec des échantillons que le calibrage est
correct à la fois pour la pente et pour l'ordonnée à l'origine, c'est-à-dire à des niveaux faibles et élevés. Il est
important de s'assurer que les valeurs moyennes obtenues à la fois avec l'appareil et la méthode de référence
ou les matériaux étalons ne sont pas statistiquement différentes.
4.3 Fréquence de contrôle du calibrage
Dans les conditions de routine, l'étalonnage de l'appareil et le réajustement éventuel de son calibrage ne sont
nécessaires que lorsque la relation entre les valeurs données par l'appareil et la référence a changé. Cela
peut se produire dans les conditions suivantes:
a) après réparation ou entretien des composants principaux de l'appareil (c'est-à-dire cellule, servo,
homogénéisateur, filtres optiques);
b) lorsque les propriétés ou la composition de la matrice examinée ont changé (influences saisonnières).
Si l'on suppose que la composition et les propriétés du lait restent inchangées pendant une période de deux
semaines ou un mois, il n'est pas nécessaire d'étalonner l'appareil trop fréquemment (par exemple chaque
semaine). Cette opération est coûteuse et, si elle est effectuée avec un trop petit nombre d'échantillons ou
avec des échantillons non recueillis dans ce but, elle peut introduire des erreurs supplémentaires qui reflètent
plus un mode opératoire d'étalonnage insuffisant qu'une variation réelle du calibrage de l'appareil.
10 © ISO et FIL 2009 – Tous droits réservés
FIL 128-2:2009(F)
4.4 Calibrage centralisé
Lorsqu'il est clairement démontré qu'un seul calibrage de l'appareil peut être utilisé pour analyser des
échantillons d'origines diverses sans perte de précision, un système centralisé de calibrage peut fonctionner.
Celui-ci peut être réalisé par un laboratoire de référence qui étalonne et calibre un appareil de référence ou
étalon selon la méthode spécifiée. Puis, au moyen de matériaux étalons appropriés, le calibrage de l'appareil
de référence peut être transféré à des appareils identiques dans d'autres laboratoires.
5 Contrôle qualité en laboratoire laitier de routine
NOTE Le présent article concerne tous les contrôles qu'un laboratoire laitier de routine est censé effectuer pour
garantir la qualité de ses résultats d'analyse. Ces recommandations peuvent être considérées comme une bonne pratique
de laboratoire.
5.1 Contrôle de la répétabilité
Le premier contrôle, et le plus fréquent, qui doit être effectué est celui de la répétabilité. Il s'agit de l'essai le
plus simple indiquant si l'appareil fonctionne correctement ou pas.
Vérifier que, en conditions de répétabilité, l'écart-type de répétabilité de l'appareil est en accord avec la
spécification donnée par la Norme internationale pertinente.
Sélectionner un ensemble de q échantillons (q = 20) de lait ou de produit laitier en bonne condition
physicochimique couvrant une large gamme de compositions. Analyser ces échantillons consécutivement
deux fois dans un ordre aléatoire de façon à prendre en compte l'éventuel effet de contamination d'un
échantillon sur l'autre. Enregistrer la différence absolue entre les résultats en double, w . Calculer l'écart-type
i
de répétabilité, s , à l'aide de l'Équation (20):
r
1/ 2
q
⎛⎞
⎜⎟
sw= (20)
ri∑
⎜⎟2q
i=1
⎝⎠
Si un plus petit nombre d'échantillons est utilisé, répéter la détermination au moins trois fois. Calculer s en
r
utilisant une analyse de variance à une voie. La variance de l'erreur, s , ou variance intra-échantillon, est un
e
estimateur sans biais de σ .
r
Il convient d'effectuer une intervention si s est supérieur à la valeur spécifiée.
r
5.2 Contrôle journalier de la stabilité à court terme de l'appareil
5.2.1 Objet
Ce contrôle est caractéristique de toute méthode alternative automatique. L'instabilité du signal de l'appareil
peut avoir plusieurs origines, par exemple une dérive électrique, une variation de température, un
encrassement des parois de la cellule, etc.
Vérifier, en analysant régulièrement un ou plusieurs échantillons de contrôle, que les résultats se situent dans
les limites de confiance acceptables, en supposant qu'aucun changement dans les caractéristiques
physicochimiques de l'échantillon de contrôle ne se produise pendant la période de contrôle. Cet essai est
utile non seulement pour vérifier la stabilité de l'appareil pendant une journée de travail, mais également d'un
jour à l'autre entre deux étalonnages de l'appareil par rapport à la méthode de référence.
© ISO et FIL 2009 – Tous droits réservés 11
FIL 128-2:2009(F)
5.2.2 Mode opératoire
5.2.2.1 Sélectionner un échantillon de composition moyenne ou, de préférence, deux échantillons de
faible et forte teneur en mesurande, en utilisant un lait de grand mélange sélectionné de bonne qualité
physicochimique. Il peut s'agir d'un lait pasteurisé du commerce pour lequel la gamme de concentration en
mesurande a été étendue par l'addition de certaines quantités du constituant mesuré (par exemple poudre de
lait écrémé, crème, concentré cellulaire, etc.).
En fonction du mesurande, appliquer, si nécessaire, un traitement thermique approprié. Préparer avec
précaution, sous agitation constante, le nombre d'échantillons de lait nécessaires pour un ou plusieurs jours
de travail. Les conserver à 4 °C avec un conservateur adéquat. De cette manière, un lait pasteurisé de bonne
qualité, conservé par exemple avec du bronopol (2-bromo-2-nitropropane-1,3-diol), peut être stocké sans
risque pendant deux semaines. Avec les appareils équipés d'un homogénéisateur, n'utiliser un lait
homogénéisé que si l'efficacité de l'homogénéisation a été vérifiée séparément.
Analyser des échantillons de contrôle à intervalles réguliers au moins trois fois par heure ou tous
les 100 échantillons, en retenant l'option la plus fréquente.
Pour surveiller la qualité de l'ensemble du mode opératoire analytique, y compris la stabilité de l'appareil,
préparer une carte de contrôle selon les principes donnés de 5.2.2.2 à 5.2.2.4.
5.2.2.2 Déterminer soigneusement la valeur pilote moyenne, m , de l'échantillon de contrôle et l'écart-
type de reproductibilité de la méthode, σ , d'un jour à l'autre ou dans la journée. S'il est inconnu, σ peut être
R R
estimé grossièrement à deux fois la valeur de l'écart-type de répétabilité.
5.2.2.3 La carte de contrôle (voir Figure 1) doit représenter
a) une ligne droite au centre correspondant à la valeur de référence, m ;
b) des «zones de confiance» inférieure et supérieure qui correspondent aux limite
...
МЕЖДУНАРОДНЫЙ ISO
СТАНДАРТ 8196-2
IDF
128-2
Второе издание
2009-10-01
Молоко. Определение и оценивание
общей точности альтернативных
методов анализа молока.
Часть 2.
Калибровка и контроль качества
в лаборатории по анализу молочной
продукции
Milk — Definition and evaluation of the overall accuracy of alternative
methods of milk analysis —
Part 2:
Calibration and quality control in the dairy laboratory
Ответственность за подготовку русской версии несёт GOST R
(Российская Федерация) в соответствии со статьёй 18.1 Устава ISO
Ссылочные номера
IDF 128-2:2009(R)
©
ISO и IDF 2009
IDF 128-2:2009(R)
Отказ от ответственности при работе в PDF
Настоящий файл PDF может содержать интегрированные шрифты. В соответствии с условиями лицензирования, принятыми
фирмой Adobe, этот файл можно распечатать или смотреть на экране, но его нельзя изменить, пока не будет получена
лицензия на установку интегрированных шрифтов в компьютере, на котором ведется редактирование. В случае загрузки
настоящего файла заинтересованные стороны принимают на себя ответственность за соблюдение лицензионных условий
фирмы Adobe. Центральный секретариат ISO не несет никакой ответственности в этом отношении.
Adobe — торговый знак Adobe Systems Incorporated.
Подробности, относящиеся к программным продуктам, использованным для создания настоящего файла PDF, можно найти в
рубрике General Info файла; параметры создания PDF оптимизированы для печати. Были приняты во внимание все меры
предосторожности с тем, чтобы обеспечить пригодность настоящего файла для использования комитетами – членами ISO. В
редких случаях возникновения проблемы, связанной со сказанным выше, просим информировать Центральный секретариат
по адресу, приведенному ниже.
ДОКУМЕНТ ЗАЩИЩЕН АВТОРСКИМ ПРАВОМ
© ISO и IDF 2009
Все права сохраняются. Если не указано иное, никакую часть настоящей публикации нельзя копировать или использовать в
какой-либо форме или каким-либо электронным или механическим способом, включая фотокопии и микрофильмы, без
предварительного письменного согласия ISO или IDF, которое должно быть получено после запроса о разрешении,
направленного по адресу, приведенному ниже.
ISO copyright office International Dairy Federation
Case postale 56 • CH-1211 Geneva 20 Diamant Building • Boulevard Auguste Reyers 80 • B-1030 Brussels
Tel. + 41 22 749 01 11 Tel. + 32 2 733 98 88
Fax + 41 22 749 09 47 Fax + 32 2 733 04 13
E-mail copyright@iso.org E-mail info@fil-idf.org
Web www.iso.org Web www.fil-idf.org
Опубликовано в Швейцарии
ii © ISO и IDF 2009 – Все права сохраняются
IDF 128-2:2009(R)
Содержание Страница
Предисловие .iv
Предисловие .v
Введение .vi
1 Область применения .1
2 Нормативные ссылки .1
3 Термины, определения и обозначения.1
3.1 Термины и определения .1
3.2 Обозначения.2
4 Калибровка приборов.3
4.1 Общие принципы.3
4.2 Общая процедура .3
4.3 Частота контроля калибровки .10
4.4 Централизованная калибровка.10
5 Контроль качества в обычных лабораториях по анализу молочной продукции .11
5.1 Верификация повторяемости .11
5.2 Ежедневная проверка кратковременной стабильности контрольно-измерительного
прибора .11
5.3 Верификация систематической погрешности между лабораториями .14
5.4 Верификация расхождения между результатами стандартного и альтернативного
метода.14
5.5 Верификация соответствия результатов альтернативного метода требованиям к
составу.16
6 Примеры.18
6.1 расчет статистических значений.18
6.2 Определение повторяемости.20
6.3 Верификация точности калибровки .21
6.4 Определение точности .22
6.5 Проверка разности между результатами стандартного и альтернативного методов .22
6.6 Заключение.23
6.7 Верификация соответствия искомым значениям и верхнему и нижнему пределам.23
Библиография.25
© ISO и IDF 2009 – Все права сохраняются iii
IDF 128-2:2009(R)
Предисловие
Международная организация по стандартизации (ISO) является всемирной федерацией
национальных организаций по стандартизации (комитетов-членов ISO). Разработка международных
стандартов обычно осуществляется техническими комитетами ISO. Каждый комитет-член,
заинтересованный в деятельности, для которой был создан технический комитет, имеет право быть
представленным в этом комитете. Международные правительственные и неправительственные
организации, имеющие связи с ISO, также принимают участие в этой работе. ISO работает в тесном
сотрудничестве с Международной электротехнической комиссией (IEC) по всем вопросам
стандартизации в области электротехники.
Проекты международных стандартов разрабатываются в соответствии с правилами, приведенными в
Директивах ISO/IEC, Часть 2.
Основная задача технических комитетов — разработка международных стандартов. Проекты
международных стандартов, принятые техническими комитетами, рассылаются комитетам-членам на
голосование. Их опубликование в качестве международных стандартов требует одобрения не менее
75 % комитетов-членов, принимающих участие в голосовании.
Следует иметь в виду, что, возможно, некоторые элементы настоящего документа могут быть
объектом патентных прав. ISO не несет ответственности за определение некоторых или всех таких
патентных прав.
ISO 8196-2|IDF 128-2 был подготовлен Техническим комитетом ISO/TC 34, Пищевые продукты,
Подкомитетом SC 5, Молоко и молочные продукты, и Международной федерацией молочной
промышленности (IDF). Стандарт опубликован ISO совместно с IDF
Настоящее второе издание ISO 8196-2|IDF 128-2 отменяет и заменяет первое издание (ISO 8196-
2:2000), которое прошло технический пересмотр.
ISO 8196|IDF 128 состоит из следующих частей под общим заголовком Молоко. Определение и оценка
общей точности альтернативных методов анализа молока:
⎯ Часть 1. Аналитические признаки альтернативных методов
⎯ Часть 2. Калибровка и контроль качества в лаборатории по анализу молочной продукции
⎯ Часть 3. Протокол оценки и валидации альтернативных количественных методов анализа
молока
iv © ISO и IDF 2009 – Все права сохраняются
IDF 128-2:2009(R)
Предисловие
Международная федерация молочной промышленности (IDF) является всемирной федерацией
предприятий молочной отрасли, каждый член которой представлен в ней своим национальным
комитетом. Каждый национальный комитет имеет право быть представленным в постоянных
комитетах IDF, осуществляющих техническую работу. IDF сотрудничает с ISO и AOAC International по
вопросам разработки стандартных методов анализа и отбора проб молока и молочных продуктов.
Проекты международных стандартов, принятые постоянными комитетами и рабочими группами,
рассылаются национальным комитетам для голосования. Их опубликование в качестве
международных стандартов требует одобрения не менее 50 % национальных комитетов IDF,
принимающих участие в голосовании.
Следует иметь в виду, что, возможно, некоторые элементы настоящего документа могут быть
объектом патентных прав. ISO не несет ответственности за определение некоторых или всех таких
патентных прав.
ISO 8196-2|IDF 128-2 был разработан Международной федерацией молочной промышленности (IDF) и
Техническим комитетом ISO/TC 34, Пищевые продукты, Подкомитетом SC 5, Молоко и молочные
продукты. Он публикуется совместно ISO и IDF.
Вся работа была выполнена Совместной рабочей группой IDF-ISO по Автоматизированным методам
Постоянного комитета по Контролю качества, статистике данных анализа и отбору проб под
эгидой руководителя проекта, г-на O. Лерея (FR).
Настоящее издание ISO 8196-2|IDF 128-2, наряду с ISO 8196-1|IDF 128-1 и ISO 8196-3|IDF 128-3,
отменяет и заменяет IDF 128:1985, который прошел технический пересмотр.
ISO 8196|IDF 128 состоит из следующих частей под общим заголовком Молоко. Определение и оценка
общей точности альтернативных методов анализа молока:
⎯ Часть 1. Аналитические признаки альтернативных методов
⎯ Часть 2. Калибровка и контроль качества в лаборатории по анализу молочной продукции
⎯ Часть 3. Протокол оценки и валидации альтернативных количественных методов анализа
молока
© ISO и IDF 2009 – Все права сохраняются v
IDF 128-2:2009(R)
Введение
Основной задачей настоящей части ISO 8196|IDF 128 является предоставление практических деталей
и рекомендаций в отношении калибровки контрольно-измерительных приборов и контроля качества в
лабораториях по анализу молока и молочной продукции, включая проверки соответствия значениям
или пределам, установленным в технических условиях.
ISO 8196-1|IDF 128-1 предназначен, главным образом, для оценки пользователями альтернативных
методов анализа, и дает руководство для обычных лабораторий, использующих эти методы.
Настоящая часть ISO 8196|IDF 128 непосредственно связана с ISO 8196-1|IDF 128-1 в отношении
определения релевантных рабочих характеристик с целью количественной оценки общей точности и
установления соответствующих стандартных предельных значений для согласования с описанным
обеспечением качества анализа. Общие концепции применимы ко всем аналитическим методам,
однако особое ударение делается на быстрые физико-химические методы, которые в настоящее
время используются для определения состава молока.
ISO 8196|IDF 128 (все части) устанавливает только одну модель линейной регрессии, в качестве
упрощенного подхода, чтобы позволить пользователям определить эквивалентность альтернативного
метода и стандартного метода. тем не менее, применение линейной регрессии эффективно, поскольку
определение равноценности метода получается только в ограниченных условиях или при высокой
корреляции между результатами стандартного метода и повседневного метода. Если высокой степени
корреляции не достигается, необходимо обратиться к другой технике моделирования обработки
данных и погрешности измерений. Сами способы моделирования, хотя и широко используются, в
международном стандарте ISO 8196|IDF 128 (все части) не устанавливаются.
vi © ISO и IDF 2009 – Все права сохраняются
МЕЖДУНАРОДНЫЙ СТАНДАРТ
IDF 128-2:2009(R)
Молоко. Определение и оценка общей точности
альтернативных методов анализа молока.
Часть 2.
Калибровка и контроль качества в лаборатории по анализу
молочной продукции
1 Область применения
Настоящая часть ISO 8196|IDF 128 дает руководство по калибровке приборов и процедурам контроля
качества для анализа молока в специальных лабораториях.
2 Нормативные ссылки
Следующие нормативные документы необходимы для применения настоящего международного
стандарта. Для жестких ссылок применяется только то издание, на которое дается ссылка. Для
плавающих ссылок применяется самое последнее издание нормативного ссылочного документа
(включая любые изменения).
ISO 8196-1|IDF 128-1:2009, Молоко. Определение и оценка общей точности альтернативных
методов анализа молока. Часть 1. Аналитические признаки альтернативных методов
ISO 8196-3|IDF 128-3:2009, Молоко. Определение и оценка общей точности альтернативных
методов анализа молока. Часть 3. Протокол оценки и валидации альтернативных количественных
методов анализа молока
3 Термины, определения и обозначения
3.1 Термины и определения
Применительно к данному документу используются термины и определения, приведенные в ISO 8196-1|IDF 128-1,
а также следующие.
3.1.1
стандартизация контрольно-измерительного прибора
standardization of an instrument
экспериментальная оценка точности калибровки контрольно-измерительного прибора по истинным
значениям, выполняемая либо стандартным методом, либо с использованием стандартных образцов,
либо с помощью стандартного прибора
3.1.2
калибровка контрольно-измерительного прибора
calibration of an instrument
регулировка сигнала от прибора, таким образом, чтобы на каждом уровне содержания компонента
среднее значение отдельных результатов испытания, получаемых на калибруемом приборе,
© ISO и IDF 2009 – Все права сохраняются 1
IDF 128-2:2009(R)
приближалось к истинному значению концентрации этого компонента
ВНИМАНИЕ! — Даже когда термин “калибровка” часто используется для обозначения и
стандартизации и калибровки приборов (см. Раздел 4), настоятельно рекомендуется применять
эти слова в соответствии с определениями, данными в 3.1.1 и 3.1.2.
3.2 Обозначения
b (угловой) коэффициент или наклон линейной регрессии
d среднее разностей d или средняя систематическая погрешность
i
d разность между средними двух параллельных результатов (двух повторностей) x и y
i i i
d относительная систематическая погрешность
rel
L предел систематической погрешности d
d
L предел относительной систематической погрешности
drel
m опорное значение для контрольной таблицы
n число параллельных экспериментов (повторностей)
P сумма произведений x и y
xy
q объем выборки (количество проб)
r предел повторяемости
r коэффициент корреляции
xy
R предел воспроизводимости
S сумма квадратов d
d
S сумма квадратов x
x
S сумма квадратов y
y
s стандартное отклонение углового коэффициента
b
s стандартная погрешность оценки x
x 0
s оценка стандартного отклонения y
y
s оценка стандартного отклонения точности
yx
t наблюдаемое значение критерия Стьюдента
obs
t t-значение распределения Стьюдента для двусторонней вероятности 1 − α
1 − α/2
t t- значение распределения Стьюдента для односторонней вероятности 1 − α
1 − α
u значение стандартного нормального распределения для двусторонней вероятности 1 − α
1 − α/2
x среднее арифметическое x
i
x среднее двух параллельных результатов (двух повторностей) x
i i
y среднее арифметическое y
i
y среднее двух параллельных результатов (двух повторностей) y
i i
yx() прогнозируемые (ожидаемые) значения по x методом линейной регрессии.
ν степень свободы
σ стандартное отклонение повторяемости
r
2 © ISO и IDF 2009 – Все права сохраняются
IDF 128-2:2009(R)
σ стандартное отклонение воспроизводимости
R
σ стандартное отклоненние y
y
σ стандартное отклонение точности
yx
σ относительное стандартное отклонение точности
yxrel
4 Калибровка приборов
4.1 Общие принципы
В данном разделе рассматриваются только общие принципы калибровки, которые применимы к
любому альтернативному методу анализа молока.
Подробные и конкретные инструкции по методу калибровки, также по предварительным проверкам,
касающимся каждой группы методов, должны даваться в конкретном документе.
Описанная здесь калибровка основана на допущении существования линейной зависимости между
альтернативным методом и стандартным методом. Рекомендуется применение обычного метода
наименьших квадратов модели линейной регрессии (OLS) со стандартным методом в качестве
зависимой переменной (ось y) , поскольку это целесообразно и надежно:
a) Измеренное остаточное стандартное отклонение структурно является самым наименьшим и не
зависит от точности калибровки, следовательно, его можно использовать для контроля калибровки
как характеристику точности метода (см. ISO 8196-1|IDF 128-1);
b) Прогнозирование истинных значений по значениям альтернативного метода и расчет связанных с
ним погрешностей упрощается;
c) Разности между результатами измерений по сравнению с применением других моделей линейной
регрессии не значительны.
4.2 Общая процедура
4.2.1 Предварительные проверки
4.2.1.1 Проверки прибора: все функциональные проверки и наладки (установка нуля)
контрольно-измерительного прибора, установленного соответствующим международным стандартом
или изготовителем, должны осуществляться до выполнения анализа.
4.2.1.2 Линейность: если нет иных указаний, зависимость между показаниями приборов и
концентрацией компонента является линейной в установленном диапазоне концентрации. Обычно,
для альтернативных методов требуется только проверить и отрегулировать линейность новых
приборов или приборов после технического обслуживания основных частей (например, испытательной
камеры (кюветы) или системы автоматического регулирования) или их замены.
4.2.1.3 Поправки на помехи (взаимокоррекции): там где компенсация приборов на мешающие
компоненты применяется для оптимизации точности, компенсацию необходимо проверить и
отрегулировать до анализа.
4.2.1.4 Проверки повторяемости и точности: повторяемость и точность прибора должны
соответствовать спецификациям соответствующего международного стандарта.
4.2.1.5 Линейность и поправки на помехи на одной матрице. Чтобы проверить одновременно
линейность (4.2.1.2) и поправки на мешающие элементы (4.2.1.3), можно приготовить серию проб на
одной молочной матрице, таким образом, чтобы охватить диапазон концентраций какого-либо
© ISO и IDF 2009 – Все права сохраняются 3
IDF 128-2:2009(R)
компонента, оставляя концентрации других компонентов постоянными. Для проверки линейности
диапазон концентрации компонента относят к измеряемой концентрации и проверяют линеаризацию
результатов измерения против теоретического соотношения компонентов или соответствующей
концентрации, рассчитанной в предыдущих анализах. Для поправки на мешающие элементы диапазон
концентраций должен относиться к мешающему элементу, также требуется проверка отсутствия
соответствующей индуцированной систематической погрешности для измеряемой концентрации.
4.2.2 Стандартизация контрольно-измерительного прибора
4.2.2.1 Испытуемые пробы
4.2.2.1.1 Общие требования
Пробы молока, отобранные специально для этой цели, или, где имеются, стандартные образцы с
аналогичными характеристиками, можно использовать для стандартизации прибора.
Чтобы получить наиболее точную оценку штриха на шкале прибора, необходимо выполнить два
следующих основных требования:
a) пробы должны охватывать весь диапазон концентраций искомого компонента;
b) остаточное стандартное отклонение из регрессии должно быть минимальным.
В зависимости от измеряемого компонента, наилучшим образом этого можно достичь путем
объединения в пул отдельных проб молока, выбранных на различных уровнях концентрации при
максимальном количестве проб, выбранных для значений, близких к экстремальным точкам диапазона,
или путем разделения и перегруппировки компонентов молока, либо путем внесения меток
(маркировки) и/или путем разбавления водой. Перед использованием необходимо подтвердить
эквивалентность альтернативных калибровочных образцов для искомого компонента путем
сопоставления с обычными пробами молока.
4.2.2.1.2 Свойства проб
Для калибровки большое значение имеет то, чтобы калибровочные пробы являлись
представительными по отношению к обычно испытываемым пробам, т.е. молоко одного и того же типа
(например, молоко от отдельных животных, сборное молоко от стада коров, молоко из одной емкости,
переработанное молоко), подвергнутое одинаковой обработке и консервированию, и происходящее из
одной и той же зоны отбора проб, производимого в одни и те же периоды времени. Период времени, в
течение которого калибровочные образцы остаются действительными, устанавливается
экспериментальным путем, с учетом изменений факторов молочного производства, связанных с
сезонной и региональной практикой животноводства.
Молоко очевидно плохого физического качества бракуют, чтобы гарантировать ввод гомогенной пробы
в прибор и надлежащее функционирование прибора (достаточная скорость течения молока).
Стандартный метод следует применять к свежему калибровочному образцу, т.е. до того, как, в
конечном счете, обрабатывать выборки в форме подвыборок.
4.2.2.1.3 Диапазон измеряемой величины
Отобранные пробы должны охватывать весь диапазон концентраций измеряемого компонента. Чем
больше диапазон, используемый для калибровки, тем более точно можно произвести выверку
калибровочного штриха. В этом отношении рекомендуется, чтобы стандартное отклонение
контрольных значений, s , соответствовало неравенству (1):
y
s W 5s (1)
y yx
4 © ISO и IDF 2009 – Все права сохраняются
IDF 128-2:2009(R)
или, равноценно, коэффициент корреляции, r , соответствовал выражению (2)
xy
r W 0,98 (2)
xy
Альтернативно, там где точность и/или диапазон измеряемой величины не удовлетворяет указанному
условию, можно рассмотреть подходящие альтернативные калибровочные образцы (4.2.2.1.1).
ПРИМЕЧАНИЕ Эквивалентно объединение проб в пулы (4.2.2.1.1), объединение в пулы отдельных данных
может послужить средством получения набора подходящих виртуальных калибровочных данных, если нельзя
достичь достаточной корреляции физическими средствами (см. ISO 8196-3|IDF 128-3:2009, 5.2.2.2.3.2).
4.2.2.1.4 Количество проб
4.2.2.1.4.1 Количество проб зависит от цели, преследуемой лабораторией, точности метода и
гетерогенности множества проб в отношении измеряемой величины.
4.2.2.1.4.2 Выбирают некоторое количество проб в соответствии с представительностью состава в
отношении основных компонентов.
Определяют число необходимых проб в отношении различного происхождения испытуемых проб и
степени их репрезентативности, достигнутой их объединением. Например, при анализе состава
количество представительных проб, рекомендованное для использования как минимальное число
проб, приведено в Таблице 1.
Таблица 1 — Происхождение и число представительных проб
Тип молока Количество представительных проб
От одного животного 100
От одного стада 40
Из одной емкости 6
Набор проб молока, полученный из молока из одной емкости или молока из
Переработанное оптовой тары, используемого для переработки, с соответствующими уровнями
концентрации измеряемой величины
В другом случае готовят и используют серию альтернативных калибровочных образцов равной
представительности из не менее девяти равномерно распределенных по диапазону концентраций
измеряемого компонента, соответствующему соединенным пробам молока.
ПРИМЕЧАНИЕ Минимальное число – девять – уровней концентрации для альтернативных калибровочных
образцов позволяет равномерно охватить основные компоненты молока (т.е. жиры, белки и лактозу) и
одновременно достаточное число комбинаций компонентов, чтобы проверить параметры прибора (линейность,
мешающие элементы).
4.2.2.1.4.3 Обеспечивают точность калибровки по всему диапазону концентраций, т.е. как указано
в 4.2.2.1.4.4 и 4.2.2.1.4.5.
4.2.2.1.4.4 Для среднего уровня концентрации выбирают минимальное число образцов, так чтобы
систематическая погрешность при калибровке (т.н. средняя систематическая погрешность d) ,
превышающая пределы ± L , установленные пользователем, была статистически значима для риска
d
погрешности α. Из этого предварительного условия следует, что пределы неопределенности
оцененной систематической погрешности не должны превышать установленные калибровочные
пределы.
Из стандартного отклонения точности, σ , оцененного по s в последнем уравнении (см.
yx yx
ISO 8196-1|IDF 128-1 и ISO 8196-3|IDF 128-3), и заранее установленных пределов систематической
© ISO и IDF 2009 – Все права сохраняются 5
IDF 128-2:2009(R)
погрешности калибровки ± L , число q должно удовлетворять условию (3):
d
22 2
uuσσ 3,84 ×σ
1/−−αα2 yx 1 /2 yx yx
LqWW ⇔ ⇔qW (3)
d
√ q
LL
dd
Или, используя пределы ± L относительной средней систематической погрешности d и
rel
drel
относительного стандартного отклонения точности σ :
yxrel
22 2
uσσ3,84 ×
1/−α2 yxrel yxrel
qqWW ⇔ (4)
LL
ddrel rel
где
u значение стандартного нормального распределения для уровня вероятностиl 1 − α;
1 − α/2
при
d=−x yxy=− ()x
dd=×100/y
rel
σσ=×(/y)100
yxrel yx
α = 0,05
ПРИМЕР
Жир: σ = 0,07 % жира по массе при L = 0,02 % принятого жира по массе ⇒ q W 49
yx
d
Число соматических клеток: σ = 10 % при L = 3 % принятых ⇒ q W 43
yxrel
drel
4.2.2.1.4.5 Для калибровочной характеристики пределы относительной неопределенности углового
коэффициента b не должны превышать максимального значения δb , определенного предварительно
rel
пользователем для систематической погрешности углового коэффициента, так чтобы погрешность,
превышающая это значение, являлась значимой. Таким образом, при наличии множества проб уже
известных в отношении σ и σ или обычного коэффициента корреляции, r , число q должно
yx y xy
удовлетворять условию (5):
⎛⎞ ⎛ ⎞
σσ
yx yx
⎜⎟ ⎜ ⎟
quWW ×100 ⇔ q 38 400 (5)
1/−α2
22 2 2 2 2
⎜⎟ ⎜ ⎟
σσ−δbbσ−δσ
yyx rel y yx rel
⎝⎠ ⎝ ⎠
Или эквивалентно
⎛⎞ ⎛ ⎞
11 1 1
⎜⎟ ⎜ ⎟
quWW ×100 − 1 ⇔ q 38 400 − 1 (6)
1/−α2
22 2 2
⎜⎟ ⎜ ⎟
rbδδr b
xy rel xy rel
⎝⎠ ⎝ ⎠
с
δb W u σ × 100/b = u × 100 [σ /(σ √q)]
rel 1−α/2 b 1−α/2 yx y
α = 0,05
ПРИМЕР
6 © ISO и IDF 2009 – Все права сохраняются
IDF 128-2:2009(R)
Жир σ = 0,5 % по массе σ = 0,07 % по массе (r = 0,990 1) с пределом δb = 4 % ⇒ q W 48
y yx xy rel
Свободные жирные: σ = 0,5 ммоль/100 г σ = 0,15 моль/100 г (r = 0,953 9) с пределом δb = 5 % ⇒ q W 152
y yx xy rel
кислоты:
4.2.2.1.5 Число параллельных анализов (повторностей)
Выполняют анализ пробы как минимум в двух повторностях.
Там где стандартное отклонение повторяемости альтернативного метода значительно превышает
стандартное отклонение стандартного метода и стандартное отклонение точности, число
параллельных анализов можно увеличить, так чтобы получить стандартные отклонения среднего от
результатов, которые будут, как минимум, равноценны в обоих методах.
Таким образом, число требуемых повторностей получается из условия (7):
⎛⎞
σ
alt
nnW (7)
⎜⎟
alt ref
σ
ref
⎝⎠
где
n число параллельных анализов стандартным методом;
ref
n число параллельных анализов альтернативным методом;
alt
σ стандартное отклонение повторяемости стандартного метода;
ref
σ стандартное отклонение повторяемости альтернативного метода.
alt
При увеличении числа параллельных анализов остаточное стандартное отклонение регрессии
уменьшается, и одновременно растет коэффициент корреляции. Если коэффициент корреляции
больше или равен 0,98, увеличивать число параллельных анализов не требуется. Дальнейшее
улучшение можно получить путем увеличения числа проб.
4.2.2.2 Статистический анализ
4.2.2.2.1 Принцип
Представленный подход основан на модели линейной регрессии OLS с предварительным условием
приблизительного постоянства распределения остатков по диапазону калибровки. Обычно, это пример
физико-химических методов, охватывающих не более чем 1 логарифмическую шкалу. В противном
случае преобразуют данные, так чтобы уровнять остаточную дисперсию по всему диапазону или
разделить диапазон на более короткие интервалы, поддиапазоны, на каждом из которых допустима
конкретная калибровка. Эти интервалы следует рассматривать по отдельности.
Перед расчетами наносят на график отдельные средние результаты альтернативного метода, x , и
i
стандартного метода, y , от q проб в координатах xy согласно ISO 8196-1|IDF 128-1:2009, Рисунок A.1.
i
Проверяют распределение точек на графике, которое должно быть линейным, правильным и
однородным.
Не учитывают пробы, четко выпадающие из «облака» точек, т.е. значительно отклоняющихся от общей
ожидаемой линейной тенденции. Пробы, лежащие вне доверительного пояса, линия регрессии
± 2,58 s (которая составляет пределы 99 % множества остатков), считают сомнительными. Для таких
yx
проб проверяют, серьезно ли повлияет на рассчитанные значения удаление таких точек в отношении
углового коэффициента и отсекаемого отрезка на координатной оси. Если да, то эти пробы удаляют.
© ISO и IDF 2009 – Все права сохраняются 7
IDF 128-2:2009(R)
4.2.2.2.2 Расчет
4.2.2.2.2.1 Вычисляют уравнение регрессии, yb=x +a, по анализу данных, используя метод
ii
наименьших квадратов, где y относится к стандартному методу, а x к прибору (см. ISO 8196-1|IDF 128-1).
i i
Рассчитывают остаточное стандартное отклонение из регрессии, s . Это значение должно попадать в
yx
пределы, установленные соответствующим международным стандартом для точности.
Рассчитывают коэффициент корреляции, r
xy
P
xy
r = (8)
xy
1/ 2
()SS
xy
Это значение не должно быть ниже 0,98.
Затем выполняют 4.2.2.2.2.2 - 4.2.2.2.2.4.
4.2.2.2.2.2 Проверяют, отличается ли угловой коэффициент статистически от 1,000 посредством
расчета стандартного отклонения b:
1/ 2
⎛⎞
s
yx
⎜⎟
s = (9)
b
⎜⎟S
x
⎝⎠
Угловой коэффициент верен, если согласуется с одним из выражений (10) или (11):
bt−+suu1,000 b t s (10)
1/−−αα2bb1 /2
b − 1
tt= u (11)
obs 1− α/2
s
b
[1]
где t значение распределения Стьюдента (см. ISO 8196-1|IDF 128-1, ISO 3534-1 и Таблицу 2).
Выражения показывают как случайную переменную, t, так и частное или наблюдаемое значение этой
переменной, t .
obs
4.2.2.2.2.3 Проверяют нуль-гипотезу, заключающуюся в том, что линия регрессии проходит через
центр тяжести выборочной совокупности, путем вычисления стандартного отклонения уравнения
регрессии, yx()=+bx a, по формуле (12):
s
yx
s = (12)
yx()
√ q
где q объем выборки.
Корректировка среднего верна, если согласуется с одним из следующих выражений: (13) - (15):
yx()−+t s uux y()x t s (13)
1/−−αα2 yx() 1 /2 yx()
⎡⎤xy−−()x t s uu0⎡⎤x−+y(x) t s (14)
1/−−αα2 yx() 1 /2 yx()
⎣⎦ ⎣⎦
xy− ()x
tt= u (15)
obs 1− α / 2
s
yx()
с числом степеней свободы q − 2 и α = 0,05.
Корректировка калибровки необходима, если угловой коэффициент и /или средняя систематическая
погрешность регрессии отличаются от 1,000 и 0, соответственно.
8 © ISO и IDF 2009 – Все права сохраняются
IDF 128-2:2009(R)
Таблица 2 — Таблица критических значений Стьюдента t для вероятности p и ν степеней свободы
p
Число степеней свободы Вероятность
ν p
0,90 0,950 0,975 0,99 0,995 0,999 0 0,999 5
1 3,078 6,314 12,706 31,821 63,657 318,309 636,6
2 1,886 2,920 4,303 6,965 9,925 22,327 31,60
3 1,638 2,353 3,182 4,541 5,841 10,215 12,94
4 1,533 2,132 2,776 3,747 4,604 7,173 8,610
5 1,476 2,015 2,571 3,365 4,032 5,893 6,859
6 1,440 1,943 2,447 3,143 3,707 5,208 5,959
7 1,415 1,895 2,365 2,998 3,499 4,785 5,405
8 1,397 1,860 2,306 2,896 3,355 4,501 5,041
9 1,383 1,833 2,262 2,821 3,250 4,297 4,781
10 1,372 1,812 2,228 2,764 3,169 4,144 4,587
11 1,363 1,796 2,201 2,718 3,106 4,025 4,437
12 1,356 1,782 2,179 2,681 3,055 3,930 4,318
13 1,350 1,771 2,160 2,650 3,012 3,852 4,221
14 1,345 1,761 2,145 2,624 2,977 3,787 4,140
15 1,341 1,753 2,131 2,602 2,947 3,733 4,073
16 1,337 1,746 2,120 2,583 2,921 3,686 4,015
17 1,333 1,740 2,110 2,567 2,898 3,646 3,965
18 1,330 1,734 2,101 2,552 2,878 3,610 3,922
19 1,328 1,729 2,093 2,539 2,861 3,579 3,883
20 1,325 1,725 2,086 2,528 2,845 3,552 3,850
21 1,323 1,721 2,080 2,518 2,831 3,527 3,819
22 1,321 1,717 2,074 2,508 2,819 3,505 3,792
23 1,319 1,714 2,069 2,500 2,807 3,485 3,767
24 1,318 1,711 2,064 2,492 2,797 3,467 3,745
25 1,316 1,708 2,060 2,485 2,787 3,450 3,725
26 1,315 1,706 2,056 2,479 2,779 3,435 3,707
27 1,314 1,703 2,052 2,473 2,771 3,421 3,690
28 1,313 1,701 2,048 2,467 2,763 3,408 3,674
29 1,311 1,699 2,045 2,462 2,756 3,396 3,659
30 1,310 1,697 2,042 2,457 2,750 3,385 3,646
31 1,309 1,696 2,040 2,453 2,744 3,375 3,633
32 1,309 1,694 2,037 2,449 2,738 3,365 3,622
33 1,308 1,692 2,035 2,445 2,733 3,356 3,611
34 1,307 1,691 2,032 2,441 2,728 3,348 3,601
35 1,306 1,690 2,030 2,438 2,724 3,340 3,591
36 1,306 1,688 2,028 2,434 2,719 3,333 3,582
37 1,305 1,687 2,026 2,431 2,715 3,326 3,574
38 1,304 1,686 2,024 2,429 2,712 3,319 3,566
39 1,304 1,685 2,023 2,426 2,708 3,313 3,558
40 1,303 1,684 2,021 2,423 2,704 3,307 3,551
45 1,301 1,679 2,014 2,412 2,690 3,281 3,520
50 1,299 1,676 2,009 2,403 2,678 3,261 3,496
55 1,297 1,673 2,004 2,396 2,668 3,245 3,476
60 1,296 1,671 2,000 2,390 2,660 3,232 3,460
70 1,294 1,667 1,994 2,381 2,648 3,211 3,435
80 1,292 1,664 1,990 2,374 2,639 3,195 3,415
90 1,291 1,662 1,987 2,368 2,632 3,183 3,400
100 1,290 1,660 1,984 2,364 2,626 3,174 3,389
200 1,286 1,653 1,972 2,345 2,601 3,131 3,339
500 1,283 1,648 1,965 2,334 2,586 3,106 3,310
Беск. (∞) 1,282 1,645 1,960 2,326 2,576 3,090 3,291
© ISO и IDF 2009 – Все права сохраняются 9
IDF 128-2:2009(R)
4.2.2.2.2.4 Критерий в 4.2.2.2.2.3 эквивалентен тестированию среднего разностей dx=−y , или
iii
средней систематической погрешности d, в сравнении с 0, когда угловой коэффициент статистически
dx=−y=−x y()x.
не отличается от 1,000, поскольку yx() = y и
В этом случае, корректировка на среднем уровне верна, если выполняется условие (16):
s s
dd
dt−+uu0 d t (16)
1/−α2 1−α/2
√√qq
при q − 1 степеней свободы и α = 0,05.
Если оба критерия (угловой коэффициент и корректировка среднего) отрицательны, отсекаемый отрезок от
оси статистически не отличается от 0, если согласуется с одним из выражений: (17) или (18):
at−+suu0 a t s
1/−−αα2aa1 /2 (17)
a
tt= u
obs 1− α / 2 (18)
s
a
при
1/ 2
⎛⎞
1 x
ss=+ ⎜⎟ (19)
ayx
⎜⎟
qS
x
⎝⎠
4.2.3 Калибровка контрольно-измерительного прибора
Регулируют угловой коэффициент калибровочной кривой и отсекаемый отрезок так, чтобы
наблюдаемая калибровочная кривая совпадала с теоретической кривой. Для правильной
калибровочной настройки необходимо следовать инструкциям изготовителя и требованиям
соответствующего международного стандарта.
В любом случае, и после выполнения окончательной корректировки, проверяют, что калибровка верна и
сточки зрения углового коэффициента, и в отношении отсекаемого отрезка, т.е. на нижнем и верхнем
уровнях, используя выборки. Необходимо убедиться, что средние значения, полученные с помощью
прибора и стандартным методом или с помощью стандартных образцов, статистически не различаются.
4.3 Частота контроля калибровки
При повседневном использовании прибора стандартизация и возможная корректировка калибровки
требуются только в том случае, когда изменяется соотношение между показаниями прибора и
опорными значениями. Это обычно происходит:
a) после ремонта или обслуживания основных компонентов прибора (например, камеры (кюветы),
сервосистемы, гомогенизатора, оптических фильтров);
b) если изменяются свойства или состав исследуемой матрицы (например, за счет сезонных изменений).
Предполагая, что состав и свойства молока остаются неизменными в течение двух недель или одного
месяца, нет необходимости стандартизовать прибор слишком часто (например, каждую неделю). Такая
процедура является дорогостоящей и, если выполняется на небольшом количестве проб или на
пробах, полученных не для этой конкретной задачи, может ввести дополнительные ошибки. Это может
произойти за счет несовершенства метода стандартизации, а не за счет реальной изменчивости
калибровки прибора.
4.4 Централизованная калибровка
Если четко продемонстрировано, что с одной калибровкой прибор можно использовать для анализа
проб различного происхождения без потери точности, возможна централизованная система
10 © ISO и IDF 2009 – Все права сохраняются
IDF 128-2:2009(R)
калибровки. Ее может проводить метрологическая лаборатория, которая стандартизует и калибрует
эталонные или образцовые приборы в соответствии с установленным методом. Тогда, с помощью
подходящих стандартных образцов, калибровку образцового прибора можно перенести на идентичные
приборы в других лабораториях.
5 Контроль качества в обычных лабораториях по анализу молочной
продукции
ПРИМЕЧАНИЕ В данном разделе описываются все проверки, которые необходимо выполнять в обычной
лаборатории по анализу молока и молочной продукции, чтобы обеспечить качество результатов анализа.
Приведенные рекомендации можно считать установившейся лабораторной практикой.
5.1 Верификация повторяемости
Первая и самая частая проверка, которую выполняют, это проверка повторяемости (сходимости)
результатов. Это самое простое испытание, указывающее, правильно или нет работает
рассматриваемый прибор.
Проверяют, чтобы в условиях повторяемости стандартное отклонение повторяемости для прибора
соответствовало техническим условиям, приведенным в соответствующем международном стандарте.
Отбирают q проб (q = 20) молока или молочного продукта в хорошем физико-химическом состоянии,
охватывая широкий диапазон по составу. Анализируют эти пробы последовательно дважды в
произвольном порядке, так чтобы учесть любой эффект остаточного действия. Записывают
абсолютную разность между параллельными результатами, w . Рассчитывают стандартное отклонение
i
повторяемости, s ,по Формуле (20):
r
1/ 2
q
⎛⎞
⎜⎟
sw= (20)
ri∑
⎜⎟2q
i=1
⎝⎠
При использовании выборки меньшего объема, определение повторяют, по меньшей мере, три раза (три
параллельных опыта на пробу). Рассчитывают s , используя однофакторный дисперсионный анализ.
r
2 2
Вариантность погрешности, s , или дисперсия внутри выборки является несмещенной оценкой σ .
e r
Необходимо принимать меры, если s превышает установленное значение.
r
5.2 Ежедневная проверка кратковременной стабильности контрольно-измерительного прибора
5.2.1 Цель проверки
Такая ежедневная проверка является типичной для автоматического альтернативного метода.
Нестабильность сигнала прибора может возникнуть по нескольким причинам, например, электрический
дрейф, колебания температуры и загрязнение стенок испытательной камеры (кюветы).
Проверяют, путем регулярного анализа одной или нескольких контрольных проб, остаются ли
результаты в рамках приемлемых допусков, принимая, что не происходит изменений основных физико-
химических параметров контрольной пробы в течение периода проверки. Такое испытание полезно не
только для проверки стабильности прибора в течение рабочего дня, но также для регулярных проверок
между двумя стандартизациями прибора стандартным методом.
5.2.2 Проведение проверки
5.2.2.1 Выбирают одну пробу среднего состава или, предпочтительно, две пробы с низким и
высоким содержанием измеряемого компонента, используя отборное молоко из оптовой тары
хорошего физико-химического качества. Это может быть товарное пастеризованное молоко, в котором
© ISO и IDF 2009 – Все права сохраняются 11
IDF 128-2:2009(R)
диапазон концентраций измеряемого компонента расширен путем добавления отмеренных количеств
этого компонента (например, сухое обезжиренное молоко, сливки или концентрат).
В зависимости от измеряемой величины применяют, там где необходимо, соответствующую
термообработку. Тщательно готовят, при постоянном перемешивании, столько порций молока, сколько
требуется на один или несколько рабочих дней. Хранят их с подходящим консервантом при
температуре 4 °C. Например, пастеризованное молоко хорошего качества, используя в качестве
консерванта, например, бронопол (2-бром-2-нитропропан-1,3-диол), можно безопасно хранить в
течение двух недель. С помощью приборов, оснащенных, например, гомогенизотором, используют
гомогенизированное молоко, только если эффективность гомогенизации проверяется отдельно.
Анализируют контрольные пробы регулярно не реже трех раз в час или после каждых ста проб, в
зависимости от того, что чаще.
Чтобы проверить качество аналитического метода в целом, включая стабильность прибора,
выполняют контрольную диаграмму в соответствии с принципами, установленными в 5.2.2.2 - 5.2.2.4.
5.2.2.2 Тщательно определяют среднее экспериментальное (опорное) значение, m ,контрольной
пробы и суточное или в течение одного дня стандартное отклонение воспроизводимости, σ ,метода.
R
Если значение σ неизвестно, его можно грубо оценить как удвоенное значение стандартного
R
отклонения повторяемости.
5.2.2.3 Контрольная диаграмма (см. Рисунок 1) должна представлять:
a) прямую линию в центре, соответствующую опорному значению, m ;
b) нижнюю и верхнюю “доверительную зону”, соответствующую вероятности 1 – α двустороннего
доверительного предела кумулятивного среднего, m, результатов контрольных проб —
рассчитывают этот предел по формуле (21):
mu± σ
01 −α/2 R
(21)
√ n
где
u частное значение стандартизованной нормальной случайной переменной U, значение которой
зависит от уровня вероятности, 1 – α,
n число анализируемых контрольных проб,
α вероятность отклонения нуль-гипотезы (m = m ), хотя она и верна — это указывает на
необходимость перерегулировки прибора, когда фактически в этом нет необходимости — чтобы
избежать слишком частой и ненужной корректировки, можно использовать уровень вероятности
0,01 , в случае чего, u = 2,58;
1–α/2
c) нижняя и верхняя “отдельные линии” соответствующие вероятности 1 – α двустороннего статистического
толерантного интервала отдельных испытаний — эти пределы рассчитывают по Формуле (22):
mk± σ (22)
0(np,,1− α/2) R
где k коэффициент, определенный для n проб и уровня вероятности, 1 – α , такой, что статистический
интервал включает, как минимум, долю совокупности p.
ПРИМЕЧАНИЕ Для бесконечного значения n, при 1 – α = 0,99 и p = 99 %, k = 2,58.
5.2.2.4 Наносят на контрольную карту каждый отдельный результат анализа контрольной пробы и
среднее арифметическое, m, результатов анализа рассматриваемых проб.
12 © ISO и IDF 2009 – Все права сохраняются
IDF 128-2:2009(R)
Принимают меры, если:
a) среднее арифметическое, m, для двух последовательных проб, выпадает по одну сторону
(верхнюю или нижнюю границу) доверительного пояса, что указывает на дрейф прибора —
отклонение обычно бывает в том же направлении, что и отдельные результаты, выпадающие за
соответствующую границу;
b)
...