

ISO 24896:2026
(Main)Notation for business reporting
- Abstract
This document establishes a standardized notation with consistent design requirements for the results of business reporting, including written reports, presentations and dashboards. The notation specifies requirements for the visual appearance of: recurring visual aspects, such as the layout of charts, tables and text; their characteristics; the labelling of content. This document is applicable to business reporting regardless of an organization’s type, size, location or the nature of products and services delivered. For further guidance on accessibility requirements, refer to Web Content Accessibility Guidelines 2.2 and ISO/IEC 23859:2023.
- Status
- Published
- Publication Date
- 10-Jun-2026
- Technical Committee
- ISO/TC 37 - Language and terminology
- Drafting Committee
- ISO/TC 37/WG 11 - Plain language
- Current Stage
- 6060 - International Standard published
- Start Date
- 11-Jun-2026
- Due Date
- 29-Jul-2027
- Completion Date
- 11-Jun-2026
ISO 24896:2026 is an International Standard from ISO that defines a standardized notation for business reporting. It specifies how written reports, presentations and dashboards should present text, charts, tables, labels, scenarios and comparisons so the same business information is read in a consistent way across organizations of any type, size or location.
What does ISO 24896:2026 specify?
ISO 24896:2026 specifies the visual notation for business reporting and how to organize reports so their content is easier to recognize and compare. The document is structured in clauses 1 to 4, covering scope, terms and definitions, and the notation requirements, followed by informative Annex A with examples.
The standard applies to business reporting results in general, including written reports, presentations and dashboards. It also points readers to Web Content Accessibility Guidelines 2.2 and ISO/IEC 23859:2023 for accessibility guidance.
| Annex | What it covers |
|---|---|
| Annex A (informative) | Examples of compliant charts and tables, including time series analysis charts, structure dimension analysis charts, tables, and chart templates for financial analysis. |
What are the key requirements of ISO 24896:2026?
ISO 24896:2026 focuses on consistency. Its main requirement is that authors use the same notation for the same meaning, so readers do not have to relearn each report.
Descriptive text elements
Clause 4.2 requires standardized technical terms, abbreviations, number formats and layout for descriptive text elements. In practice, teams need a corporate glossary and stable conventions for separators, currencies, dates, negative values and time periods.
Titles must identify the content and include the relevant “who”, “what” and “when” information. ISO 24896:2026 keeps evaluations such as conclusions or recommendations out of titles and places them in key messages or annotations instead.
Legends, category labels and data labels should be placed close to the visual they explain. That reduces back-and-forth reading and makes charts and tables faster to interpret.
Explanatory text elements
Clause 4.3 standardizes the layout of key messages and annotations. A key message carries the main insight or conclusion of a report or page, while an annotation adds context to a specific visual or component.
For readers, this means the message hierarchy is clear: titles identify the subject, key messages state the takeaway, and annotations provide supporting detail.
Charts and tables
Clause 4.4 requires the same chart type to be used for the same purpose and prefers linear charts such as columns, bars and lines. It also discourages misleading forms such as pie charts, radar charts and speedometers when linear comparisons are clearer.
The standard requires consistent category widths, visible empty categories when needed, zero-based value axes for linear charts, and identical scales for the same unit on one page, slide or screen. In practice, that prevents visual distortion when comparing periods or measures.
Clause 4.5 applies the same idea to tables by standardizing row and column types. It also allows embedded variance bars so table values can be understood both numerically and visually.
Business dimensions and scenarios
Clause 4.6 standardizes how business dimensions are shown. Absolute measures use full-size visual elements, while relative measures are shown with narrower ones so the reader can tell them apart at a glance.
Time periods are shown left to right in chronological order, and longer periods use wider categories. Scenario types are also visually distinct: actual data use solid dark fill, planned data use outlines with very light fill, and forecasted data use outlined hatching.
That matters when comparing actual, plan and forecast figures because the audience can recognize the scenario type before reading the label.
Comparisons and highlighting
Clause 4.7 standardizes variance notation, time comparisons and category comparisons. Variances carry explicit plus or minus signs, and their visual emphasis uses color to show whether the impact on the business target is desirable, undesirable or neutral.
Time comparisons, such as time spans, period-to-date and period-to-go accumulations, need clear labels so the time frame is unambiguous. Category comparisons use consistent labels for averages, rankings, indexed categories and normalized stacked charts.
Clause 4.8 adds highlighting markers for differences, trends and individual values or labels. These markers help the reader focus on what changed, how fast it changed, and which values support the key message.
What terms does ISO 24896:2026 define?
- Notation - a formal syntax and its meaning for representing information.
- Business reporting - the exchange of business information between individuals or systems using a common system of symbols, signs or behaviour.
- Report - an information item describing results of activities in business reporting, including presentations and dashboards.
- Visual - a graphical and textual representation of information that can stand alone, such as a chart, table, text object or image.
- Key message - the main statement the author wants to convey with an entire report or with one page, slide or screen.
- Business dimension - a set of individual, non-overlapping elements used to categorize data points.
- Scenario - a data layer to be compared, such as actual, plan, budget or forecast.
- Variance - the difference between corresponding data values from two scenarios.
Who uses ISO 24896:2026?
ISO 24896:2026 is used by organizations that want business reports to be easier to read and compare across teams and tools. It is also relevant to certification bodies assessing people, tools and organizational conformance, and to buyers evaluating business reporting software.
Software developers use it when building reporting tools, trainers use it when teaching report design, and consultants use it when designing dashboards and report layouts. It is also useful for authors and readers in finance, management reporting, operations and other business functions that rely on charts, tables and dashboards.
Which standards are used with ISO 24896:2026?
ISO 24896:2026 builds on ISO 24495-1:2023 for plain language, so the whole report is expected to follow plain-language principles. It also points readers to Web Content Accessibility Guidelines (WCAG) 2.2 and ISO/IEC 23859:2023 for accessibility-related guidance.
For formatting conventions, it notes that number separators can follow ISO 80000-1:2022, currency codes can follow ISO 4217:2015, and date and time notation can follow ISO 8601-1:2019. The terminology used in the document is adapted from several ISO and ISO/IEC/IEEE sources, including ISO/IEC 11179-3:2023, ISO 5127:2017, ISO/IEC/IEEE 15289:2019, ISO 28564-2:2016, ISO 24612:2012, ISO/IEC/IEEE 15939:2017 and ISO/IEC/IEEE 24765:2017.
What does the ISO 24896:2026 document contain?
ISO 24896:2026 contains figures and worked examples showing how to apply the notation in charts and tables. The examples cover time series analysis, structure dimension analysis, table layouts, and financial analysis templates.
It also shows specific visual treatments for titles, legends, data labels, scenario notation, variances, time comparisons and highlighting markers. Annex A gives compliant examples that readers can use to design reports, check tool output or support training and review.
Frequently Asked Questions
ISO 24896:2026 is a standard published by the International Organization for Standardization (ISO). Its full title is "Notation for business reporting". This standard covers: This document establishes a standardized notation with consistent design requirements for the results of business reporting, including written reports, presentations and dashboards. The notation specifies requirements for the visual appearance of: recurring visual aspects, such as the layout of charts, tables and text; their characteristics; the labelling of content. This document is applicable to business reporting regardless of an organization’s type, size, location or the nature of products and services delivered. For further guidance on accessibility requirements, refer to Web Content Accessibility Guidelines 2.2 and ISO/IEC 23859:2023.
This document establishes a standardized notation with consistent design requirements for the results of business reporting, including written reports, presentations and dashboards. The notation specifies requirements for the visual appearance of: recurring visual aspects, such as the layout of charts, tables and text; their characteristics; the labelling of content. This document is applicable to business reporting regardless of an organization’s type, size, location or the nature of products and services delivered. For further guidance on accessibility requirements, refer to Web Content Accessibility Guidelines 2.2 and ISO/IEC 23859:2023.
ISO 24896:2026 is classified under the following ICS (International Classification for Standards) categories: 01.140.20 - Information sciences. The ICS classification helps identify the subject area and facilitates finding related standards.
ISO 24896:2026 is available in PDF format for immediate download after purchase. The document can be added to your cart and obtained through the secure checkout process. Digital delivery ensures instant access to the complete standard document.
Standards Content (Sample)
International
Standard
ISO 24896
First edition
Notation for business reporting
2026-06
Reference number
© ISO 2026
All rights reserved. Unless otherwise specified, or required in the context of its implementation, no part of this publication may
be reproduced or utilized otherwise in any form or by any means, electronic or mechanical, including photocopying, or posting on
the internet or an intranet, without prior written permission. Permission can be requested from either ISO at the address below
or ISO’s member body in the country of the requester.
ISO copyright office
CP 401 • Ch. de Blandonnet 8
CH-1214 Vernier, Geneva
Phone: +41 22 749 01 11
Email: copyright@iso.org
Website: www.iso.org
Published in Switzerland
ii
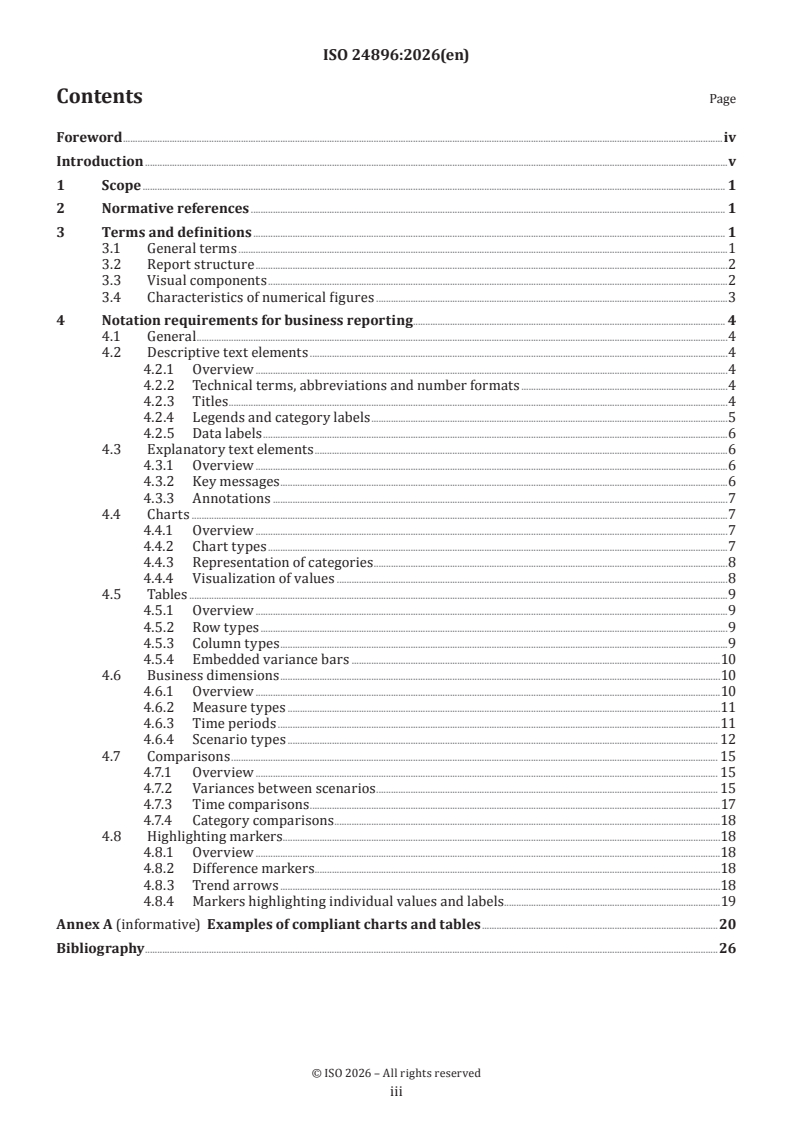
Contents Page
Foreword .iv
Introduction .v
1 Scope . 1
2 Normative references . 1
3 Terms and definitions . 1
3.1 General terms .1
3.2 Report structure .2
3.3 Visual components .2
3.4 Characteristics of numerical figures .3
4 Notation requirements for business reporting . 4
4.1 General .4
4.2 Descriptive text elements .4
4.2.1 Overview .4
4.2.2 Technical terms, abbreviations and number formats .4
4.2.3 Titles .4
4.2.4 Legends and category labels .5
4.2.5 Data labels .6
4.3 Explanatory text elements .6
4.3.1 Overview .6
4.3.2 Key messages .6
4.3.3 Annotations .7
4.4 Charts .7
4.4.1 Overview .7
4.4.2 Chart types .7
4.4.3 Representation of categories .8
4.4.4 Visualization of values .8
4.5 Tables .9
4.5.1 Overview .9
4.5.2 Row types .9
4.5.3 Column types .9
4.5.4 Embedded variance bars .10
4.6 Business dimensions .10
4.6.1 Overview .10
4.6.2 Measure types .11
4.6.3 Time periods .11
4.6.4 Scenario types . 12
4.7 Comparisons . 15
4.7.1 Overview . 15
4.7.2 Variances between scenarios . 15
4.7.3 Time comparisons .17
4.7.4 Category comparisons .18
4.8 Highlighting markers . .18
4.8.1 Overview .18
4.8.2 Difference markers . .18
4.8.3 Trend arrows .18
4.8.4 Markers highlighting individual values and labels.19
Annex A (informative) Examples of compliant charts and tables .20
Bibliography .26
iii
Foreword
ISO (the International Organization for Standardization) is a worldwide federation of national standards
bodies (ISO member bodies). The work of preparing International Standards is normally carried out through
ISO technical committees. Each member body interested in a subject for which a technical committee
has been established has the right to be represented on that committee. International organizations,
governmental and non-governmental, in liaison with ISO, also take part in the work. ISO collaborates closely
with the International Electrotechnical Commission (IEC) on all matters of electrotechnical standardization.
The procedures used to develop this document and those intended for its further maintenance are described
in the ISO/IEC Directives, Part 1. In particular, the different approval criteria needed for the different types
of ISO document should be noted. This document was drafted in accordance with the editorial rules of the
ISO/IEC Directives, Part 2 (see www.iso.org/directives).
ISO draws attention to the possibility that the implementation of this document may involve the use of (a)
patent(s). ISO takes no position concerning the evidence, validity or applicability of any claimed patent
rights in respect thereof. As of the date of publication of this document, ISO had not received notice of (a)
patent(s) which may be required to implement this document. However, implementers are cautioned that
this may not represent the latest information, which may be obtained from the patent database available
at www.iso.org/patents. ISO shall not be held responsible for identifying any or all such patent rights.
Any trade name used in this document is information given for the convenience of users and does not
constitute an endorsement.
For an explanation of the voluntary nature of standards, the meaning of ISO specific terms and expressions
related to conformity assessment, as well as information about ISO's adherence to the World Trade
Organization (WTO) principles in the Technical Barriers to Trade (TBT), see www.iso.org/iso/foreword.html.
This document was prepared by Technical Committee ISO/TC 37, Language and terminology.
Any feedback or questions on this document should be directed to the user’s national standards body. A
complete listing of these bodies can be found at www.iso.org/members.html.
iv
Introduction
Authors must make decisions about the best way to present information – by text, visuals or a combination
of both – to ensure it is easily understood and effectively conveys the intended message.
[1]
As this document builds on the foundation for plain language in ISO 24495-1:2023 , it is assumed that the
principles of plain language will be applied to the whole report.
This document will help further improve the clarity of business reporting overall by establishing consistent
design requirements (a standardized notation) for data visuals, such as charts and tables, and for text
objects that add associated meaning.
Without consistent notation, the visual design in business reporting depends on individual design
preferences and the capabilities of tools used. Two authors can each create a different design to show the
same business facts. The audience then needs to familiarize themselves with the author-specific design
before they can understand the content. This delay adversely affects the time needed for understanding and
endangers the quality of decision-making. This applies specially when busy business managers need to read
several written reports, see presentations and check dashboards from various authors.
This inconsistency contrasts with notation practices in other disciplines. For example, two musicians
writing the same melody in the same key will produce nearly identical scores.
Consistent notation assists the audience to recognize patterns and grasp the meaning quickly, clearly
and accurately. Also organizations will save time and money as it will be quicker for authors to use an
existing standard rather than having to develop custom notations and then negotiate them with internal
stakeholders.
Consistent notation enhances the clarity of business reporting not only within an organization, but also
for external recipients such as customers, suppliers, financial institutions, supervisory bodies, public
authorities and other interested parties.
There are two types of requirements in this document, as follows:
a) Universal requirements that define common notation to be used by all organizations to assist
communication.
b) Organizational requirements that allow an organization to choose a notation, provided it is applied
consistently. In this case, this document also recommends effective practices, occasionally referencing
corresponding ISO guidelines.
This document is intended to be used by:
— organizations seeking to make their business reports more understandable and efficient;
— certification bodies assessing individuals, tools and organizational compliance with business reporting
standards;
— buyers evaluating business reporting tools;
— software developers providing tools for business reporting;
— trainers delivering education or training in report design;
— consultants providing professional services for dashboard design and implementation.
This document is based on suggestions for consistent business reporting notation developed by the
International Business Communication Standards (IBCS) Association. These suggestions have been
[2]
successfully used in practice for many years.
v
International Standard ISO 24896:2026(en)
Notation for business reporting
1 Scope
This document establishes a standardized notation with consistent design requirements for the results
of business reporting, including written reports, presentations and dashboards. The notation specifies
requirements for the visual appearance of:
— recurring visual aspects, such as the layout of charts, tables and text;
— their characteristics;
— the labelling of content.
This document is applicable to business reporting regardless of an organization’s type, size, location or the
nature of products and services delivered.
[3]
For further guidance on accessibility requirements, refer to Web Content Accessibility Guidelines 2.2 and
[4]
ISO/IEC 23859:2023 .
2 Normative references
There are no normative references in this document.
3 Terms and definitions
For the purposes of this document, the following terms and definitions apply.
ISO and IEC maintain terminology databases for use in standardization at the following addresses:
— ISO Online browsing platform: available at https:// www .iso .org/ obp
— IEC Electropedia: available at https:// www .electropedia .org/
3.1 General terms
3.1.1
notation
formal syntax and associated semantics for the representation of information
EXAMPLE Music notation, notation of maps, notation of electric circuits, notation of construction plans.
Note 1 to entry: A formal syntax consists of a set of symbols and the rules for their use.
Note 2 to entry: A formal syntax is often intended for machine processing.
[5]
[SOURCE: ISO/IEC 11179-3:2023 , 3.2.36, modified — Example replaced.]
3.1.2
business reporting
process by which business information is exchanged between individuals or systems using a common
system of symbols, signs or behaviour
[6]
[SOURCE: ISO 5127:2017 , 3.1.8.04, modified — Term “communication” replaced by “business reporting”,
“business” added.]
3.1.3
report
information item that describes the results of activities such as investigations, observations, assessments or
tests in business reporting (3.1.2)
Note 1 to entry: Reports include presentations (3.1.4) and dashboards (3.1.5).
[7]
[SOURCE: ISO/IEC/IEEE 15289:2019 , 3.1.22, modified — “in business reporting” added. Note 1 to entry
added.]
3.1.4
presentation
verbal communication of information on a specific topic to a specific audience
3.1.5
dashboard
software application for analysing information on a specific topic for a specific audience
EXAMPLE Financial dashboard, human resources dashboard.
3.1.6
author
individual or organization who develops or helps develop a report (3.1.3)
[1]
[SOURCE: ISO 24495-1:2023 , 3.4, modified — “documents” replaced by “a report”. Example deleted.]
3.1.7
reader
member of the intended audience for a report (3.1.3)
[1]
[SOURCE: ISO 24495-1:2023 , 3.2, modified — “a document” replaced by “a report”. Notes to entry deleted.]
3.2 Report structure
3.2.1
visual
graphical and textual representation of information that can stand alone
EXAMPLE Chart, table, text object or image.
3.2.2
visual component
element including graphical symbol, arrow, text, numeral, illustration, colour and shape
EXAMPLE Columns, bars, lines, axes, legends and data labels in charts, rows and columns in tables, as well as key
messages, titles and annotations.
[8]
[SOURCE: ISO 28564-2:2016 , 3.3, modified — “in a sign” deleted. “Element” in the term and “component”
in the definition exchanged. Examples added.]
3.3 Visual components
3.3.1
key message
main statement the author (3.1.6) wants to convey with an entire report (3.1.3) or a single page, a slide or a
screen from it
EXAMPLE Detections, explanations or recommended actions.
Note 1 to entry: Also refers to the visual component (3.2.2) that contains the message.
3.3.2
title
words or symbols at the head of an entire report (3.1.3), a page, slide or screen of it or a single visual (3.2.1)
that identify its content
Note 1 to entry: Titles do not contain any evaluative aspects.
[6]
[SOURCE: ISO 5127:2017 3.7.4.01 modified — “a document” replaced by “an entire report, a page, slide or
screen of it or a single visual”, “that identify it and normally distinguish it from other documents” replaced
by “that identify its content”. Note 1 to entry replaced.]
3.3.3
annotation
information added to primary data, independent of its representation
[9]
[SOURCE: ISO 24612:2012 , 2.3, modified — “linguistic” at the beginning of the definition deleted.]
3.4 Characteristics of numerical figures
3.4.1
business dimension
dimension
set of one characteristic area composed of individual, non-overlapping elements categorizing data points
3.4.2
structure dimension
structure
business dimension (3.4.1) composed of elements other than business measure (3.4.4), scenario (3.4.5) and
time period
EXAMPLE Companies, regions, sales channels or products.
3.4.3
category
element of a business dimension (3.4.1)
EXAMPLE “Sales”, “Budget”, “January”, “Canada”, “Bicycles”.
Note 1 to entry: Also used as designation for segments of a category axis representing elements of a business dimension
(3.4.1).
3.4.4
business measure
measure
variable to which a value is assigned as the result of measuring an organization’s performance
EXAMPLE “Sales”, “Inventory”, “Employee turnover rate”.
[10]
[SOURCE: ISO/IEC/IEEE 15939:2017 , 3.15, modified — “business” added to the term, “result of
measurement” replaced by “result of measuring an organization’s performance”. Note 1 to entry deleted.
Example added.]
3.4.5
scenario
data layer to be compared
EXAMPLE “Actual”, “Previous year”, “Plan”, “Budget”, “Forecast” or benchmarks such as competitor data or
market averages.
Note 1 to entry: Sometimes a scenario is also referred to as data type or version.
3.4.6
variance
quantifiable deviation, departure or divergence away from a known baseline or expected value
Note 1 to entry: In this document, “variance” refers to the difference between the corresponding data values from two
scenarios (3.4.5).
[11]
[SOURCE: ISO/IEC/IEEE 24765:2017 , 3.4526, modified — Note 1 to entry added.]
4 Notation requirements for business reporting
4.1 General
Consistent notation simplifies and accelerates the understanding of business reporting by standardizing
terminology, textual elements, chart and table layouts, as well as the notation of business dimensions,
comparisons and highlighting markers.
Some notation requirements are directly illustrated with corresponding figures. For further illustrations,
see the examples of compliant charts and tables in Annex A.
4.2 Descriptive text elements
4.2.1 Overview
The organization shall standardize technical terms, abbreviations, number and date formats and the layout
for all types of descriptive text elements such as legends and labels.
4.2.2 Technical terms, abbreviations and number formats
Standardize all technical terms, such as the names of measures, scenarios, time periods and categories of
structure dimensions. Create a corporate glossary with clear definitions and abbreviations.
Use consistent formats for numbers, units and dates, such as:
a) decimal and thousand separators;
b) negative values;
c) currency abbreviations;
d) prefixes for units of measurement;
e) dates and time periods.
[12]
NOTE The consistent formats can follow relevant standards such as ISO 80000-1:2022 for separators,
[13] [14]
ISO 4217:2015 for currencies and ISO 8601-1:2019 for dates and time periods. They can also reflect customary
usage in one language or one country.
4.2.3 Titles
Use a descriptive title to identify the content of an entire report, a page, slide or screen of it or a single visual,
and include anything that is needed to understand it. Do not include in the title any evaluations, such as
interpretations, conclusions or propositions. These aspects are reserved for explanatory text elements such
as key messages (see 4.3.2) and annotations (see 4.3.3).
Include the following information in titles:
a) Reporting entities (“who”): Elements of a structure dimension representing the subject of the report,
such as organization units, lines of business, projects or combinations thereof.
b) Business measures (“what”): The business measures including their units of measurement.
c) Time periods (“when”): The reporting periods or date of reporting, as necessary for understanding.
Add to the title any other information such as scenarios or variances, if necessary for understanding.
Place and lay out titles consistently. For example, arrange “who”, “what” and “when” on three lines in the
upper left corner of a page, slide, screen or visual and put the business measures in bold font, as shown in
Figure 1.
Figure 1 — Descriptive titles
If there is more than one visual on a page, slide or screen, include in a page title only those aspects that apply
to the whole page. In the title for the visual, include aspects that relate to the visual only. The title for the
visual in combination with the page title identifies the “Who”, “What” and “When” of a visual.
4.2.4 Legends and category labels
To avoid making the reader look back and forth, place legends and category labels as close as possible to the
connected visual component. Write legends and category labels horizontally.
If possible, integrate legends labelling data series into charts. In column charts, place these legends either to
the left of the leftmost column or to the right of the rightmost column.
In bar charts, position legends labelling data series above the top bar, as shown in Figure 2.
Figure 2 — Integrated legends of data series in column charts and bar charts
4.2.5 Data labels
Data labels show the values of data points represented by visual components.
To avoid making the reader look back and forth, place data labels as close as possible to the visual component
to be labelled.
Avoid adding unnecessary and distracting data labels. For example, omit labels of small visual components
that represent values of minor importance.
If possible, write labels horizontally.
In column charts, place data labels above or below the columns. In stacked columns, place data labels in the
respective segments and the total above or below.
In bar charts, place data labels right or left of the bars. In stacked bars, place data labels in the respective
segments and the total to the right or left, as shown in Figure 3.
Figure 3 — Integrated data labels in column charts and bar charts
4.3 Explanatory text elements
4.3.1 Overview
The organization shall standardize the layout for all types of explanatory text elements such as key messages
and annotations.
4.3.2 Key messages
A key message contains the primary insight or conclusion of an entire report or a single page, slide or screen
from it.
Position and layout key messages consistently across all reports. For example, place the message at the top
of a page, slide or screen, either above the title (see Figure 4) or to the right of the title to save vertical space,
especially in landscape layout.
Figure 4 — Consistent layout of key messages, annotations and reference markers
4.3.3 Annotations
An annotation provides context or additional explanations related to a specific visual or component in
written reports and dashboards (see annotations on the right-hand side of Figure 4).
Lay out annotations consistently across all reports to enhance readability.
NOTE Comprehension improves when an annotation visually refers to the related visual or component. This can
be achieved by integrating the annotation directly into the relevant component or by using consistently designed
reference markers to connect the annotation with its corresponding visual component.
4.4 Charts
4.4.1 Overview
Authors shall: use the same chart types for the same purposes; ensure a uniform width for the segments of
category axes; and avoid misleading pres
...