

ASTM E3427-24
(Guide)Standard Guide for Measuring Intensity, Polydispersity, Size, Zeta Potential, Molecular Weight, and Concentration of Nanoparticles in Liquid Suspension Using Laser-Amplified Detection/Power Spectrum Analysis (LAD/PSA) Technology
General Information
- Abstract
SIGNIFICANCE AND USE
4.1 In this guide, the conditions, measurement apparatus, and procedures for measuring several characteristics of nanoparticle properties on three different instrument platforms using laser-amplified detection/power spectrum analysis (LAD/PSA) technology are described. This is a more recently developed technology, commercialized in 1990, than the older technology known as either photon correlation spectroscopy (PCS) or quasi-elastic light scattering (QLS)—those titles are interchangeable—developed first in 1961. Nanoparticle tracking analysis (NTA) is the most recent DLS technology to be commercialized. All three of these technologies fall under the broader category of DLS, based on the “dynamic” movement of the measured nanoparticles under Brownian motion.
4.2 DLS in the lower end of the nanometre size range becomes progressively more difficult as the particle optical scattering coefficients drop sharply, reducing the scattered light intensity. The advantage of the heterodyne detection mode over the homodyne detection mode, especially at the low end of the nanometre range, will be explained.
4.3 The LAD/PSA technology will be described and the major differences between it and the PCS-QLS and NTA technologies will be made clear. For thorough discussions of PCS-QLS, refer to Guide E2490, Test Method E3247, and ISO 22412 Annex Section A.1. For a thorough discussion of nanoparticle tracking analysis (NTA), refer to Guide E2834. For detailed information on laser-amplified detection/frequency power spectrum (LAD/FPS) technology, refer to ISO 22412 Annex Section A.2. General information on particle characterization practices can be found in Practice E1817, and nanotechnology terminology is given in Terminology E2456. Detailed information on sampling for particle characterization can be found in ISO 14488.
SCOPE
1.1 The technology, laser-amplified detection/power spectrum analysis (LAD/PSA), is available in three different platforms, which will be designated as Platforms A, B, and C.
1.1.1 Platform A—This is a solid-state probe configuration that serves as the optical bench in each of the platforms. It consists of an optical fiber coupler with a y-beam splitter that directs the scattered light signal from the nanoparticles at 180° back to a photodiode detector. The sensing end of the probe can be immersed in a suspension or positioned to measure one drop of a sample on top of the sensing surface.
1.1.2 Platform B—The same probe is mounted in a case, positioned horizontally, to detect the signal from either a disposable or permanent cuvette.
1.1.3 Platform C—Two probes are mounted in a case, horizontally, at opposite sides of a permanent sample cell. Both size distribution and zeta potential can be measured in this configuration.
1.2 The laser beam travelling through the probe measuring the scattered light from the sample of nanoparticles, in all three platforms, is partially reflected back to the same photodiode detector, and the high optical power of the laser is added to the low optical power of the scattered light signal. The interference (mixing or beating) of those two signals is known as heterodyne beating. The resulting high-power detected signal provides the highest signal-to-noise ratio among dynamic light-scattering (DLS) technologies.
1.3 This combined, amplified, optical signal is converted with a Fast Fourier transform (FFT) into a frequency power spectrum, then into a logarithmic power spectrum that is deconvolved into number and volume size distributions. The mean intensity, polydispersity, number and volume size distributions, concentration, and molecular weight can be reported in all platforms, plus zeta potential on Platform C.
1.4 This technology is capable of measuring nanoparticles in a size range from 2.0 nanometres (nm) to 10 micrometres (µm), at concentrations in a suspending liquid medium up to 40 % cc/mL for all parameters given in 1.3.
1.5 Units...
- Status
- Published
- Publication Date
- 31-Jan-2024
- Technical Committee
- E29 - Particle and Spray Characterization
- Drafting Committee
- E29.02 - Non-Sieving Methods
Buy Documents
ASTM E3427-24 - Standard Guide for Measuring Intensity, Polydispersity, Size, Zeta Potential, Molecular Weight, and Concentration of Nanoparticles in Liquid Suspension Using Laser-Amplified Detection/Power Spectrum Analysis (LAD/PSA) Technology
Overview
ASTM E3427-24 is a comprehensive standard guide developed by ASTM International for measuring key attributes of nanoparticles in liquid suspension. The standard specifically addresses the measurement of intensity, polydispersity, size, zeta potential, molecular weight, and concentration using Laser-Amplified Detection/Power Spectrum Analysis (LAD/PSA) technology. This method, a recent advancement in dynamic light scattering (DLS) technology, provides highly sensitive and accurate characterization of nanoparticles, covering particle sizes from 2.0 nanometres to 10 micrometres and concentrations up to 40% volume per millilitre.
Key Topics
Laser-Amplified Detection/Power Spectrum Analysis (LAD/PSA):
- LAD/PSA employs a laser to amplify the scattered light signal from nanoparticles, resulting in optimized signal-to-noise ratios across a wide size and concentration range.
- It uses heterodyne detection to improve accuracy at the lower nanometre scale, which is challenging for traditional DLS methods.
Measurement Platforms:
- Platform A: Solid-state probe for direct sample immersion or drop-on-probe analysis.
- Platform B: Probe within a case for analysis using cuvettes.
- Platform C: Twin-probe configuration for simultaneous size and zeta potential assessment.
Parameters Measured:
- Mean Intensity
- Polydispersity Index (PI)
- Size Distributions (number/volume)
- Concentration
- Molecular Weight
- Zeta Potential (Platform C only)
Advanced Data Processing:
- Use of Fast Fourier Transform (FFT) and logarithmic conversion delivers detailed frequency power spectra.
- Deconvolution techniques enable the determination of number and volume size distributions.
Sample Preparation and Stability:
- Proper dispersion and ionic strength are critical for reliable results.
- Use of ionic and non-ionic surfactants enhances suspension stability and measurement quality.
Applications
The ASTM E3427-24 standard is valuable across a range of fields where accurate nanoparticle characterization is critical:
- Nanotechnology Research & Development:
- Determining the physical and chemical properties of nanoparticles for advanced material design.
- Pharmaceuticals and Biotechnology:
- Assessing drug delivery systems, vaccine formulations, and complex suspensions for size, stability, and potency.
- Paints, Inks, Pigments, and Coatings:
- Ensuring batch-to-batch quality and performance through consistent particle size and distribution profiling.
- Environmental and Chemical Analysis:
- Monitoring and controlling nanoparticles in industrial effluents and environmental samples.
- Quality Assurance Laboratories:
- Routine assessment of raw materials and final products in compliance with global standards.
Related Standards
Applying ASTM E3427-24 often brings together a suite of supporting international standards and guides for nanoparticle characterization, dynamic light scattering, and terminology:
- ASTM E2490: Guide for Measurement of Particle Size Distribution of Nanomaterials in Suspension by Photon Correlation Spectroscopy (PCS)
- ASTM E3247: Test Method for Measuring the Size of Nanoparticles in Aqueous Media Using Dynamic Light Scattering
- ASTM E2834: Guide for Measurement of Particle Size Distribution of Nanomaterials in Suspension by Nanoparticle Tracking Analysis (NTA)
- ASTM E2456: Terminology Relating to Nanotechnology
- ASTM E1817: Practice for Controlling Quality of Radiological Examination by Using Representative Quality Indicators
- ISO 22412: Particle Size Analysis - Dynamic Light Scattering
- ISO 14488: Particulate Material - Sampling and Sample Splitting for the Determination of Particulate Properties
Summary
ASTM E3427-24 sets a robust, internationally recognized framework for accurate nanoparticle size analysis and characterization in liquid suspensions. Leveraging LAD/PSA technology, laboratories and industries benefit from enhanced measurement sensitivity for quality assurance, product development, and research innovation in the rapidly evolving field of nanotechnology. For reliable results and regulatory compliance, referencing ASTM E3427-24 and its related standards is regarded as best practice.
Buy Documents
ASTM E3427-24 - Standard Guide for Measuring Intensity, Polydispersity, Size, Zeta Potential, Molecular Weight, and Concentration of Nanoparticles in Liquid Suspension Using Laser-Amplified Detection/Power Spectrum Analysis (LAD/PSA) Technology
Frequently Asked Questions
ASTM E3427-24 is a guide published by ASTM International. Its full title is "Standard Guide for Measuring Intensity, Polydispersity, Size, Zeta Potential, Molecular Weight, and Concentration of Nanoparticles in Liquid Suspension Using Laser-Amplified Detection/Power Spectrum Analysis (LAD/PSA) Technology". This standard covers: SIGNIFICANCE AND USE 4.1 In this guide, the conditions, measurement apparatus, and procedures for measuring several characteristics of nanoparticle properties on three different instrument platforms using laser-amplified detection/power spectrum analysis (LAD/PSA) technology are described. This is a more recently developed technology, commercialized in 1990, than the older technology known as either photon correlation spectroscopy (PCS) or quasi-elastic light scattering (QLS)—those titles are interchangeable—developed first in 1961. Nanoparticle tracking analysis (NTA) is the most recent DLS technology to be commercialized. All three of these technologies fall under the broader category of DLS, based on the “dynamic” movement of the measured nanoparticles under Brownian motion. 4.2 DLS in the lower end of the nanometre size range becomes progressively more difficult as the particle optical scattering coefficients drop sharply, reducing the scattered light intensity. The advantage of the heterodyne detection mode over the homodyne detection mode, especially at the low end of the nanometre range, will be explained. 4.3 The LAD/PSA technology will be described and the major differences between it and the PCS-QLS and NTA technologies will be made clear. For thorough discussions of PCS-QLS, refer to Guide E2490, Test Method E3247, and ISO 22412 Annex Section A.1. For a thorough discussion of nanoparticle tracking analysis (NTA), refer to Guide E2834. For detailed information on laser-amplified detection/frequency power spectrum (LAD/FPS) technology, refer to ISO 22412 Annex Section A.2. General information on particle characterization practices can be found in Practice E1817, and nanotechnology terminology is given in Terminology E2456. Detailed information on sampling for particle characterization can be found in ISO 14488. SCOPE 1.1 The technology, laser-amplified detection/power spectrum analysis (LAD/PSA), is available in three different platforms, which will be designated as Platforms A, B, and C. 1.1.1 Platform A—This is a solid-state probe configuration that serves as the optical bench in each of the platforms. It consists of an optical fiber coupler with a y-beam splitter that directs the scattered light signal from the nanoparticles at 180° back to a photodiode detector. The sensing end of the probe can be immersed in a suspension or positioned to measure one drop of a sample on top of the sensing surface. 1.1.2 Platform B—The same probe is mounted in a case, positioned horizontally, to detect the signal from either a disposable or permanent cuvette. 1.1.3 Platform C—Two probes are mounted in a case, horizontally, at opposite sides of a permanent sample cell. Both size distribution and zeta potential can be measured in this configuration. 1.2 The laser beam travelling through the probe measuring the scattered light from the sample of nanoparticles, in all three platforms, is partially reflected back to the same photodiode detector, and the high optical power of the laser is added to the low optical power of the scattered light signal. The interference (mixing or beating) of those two signals is known as heterodyne beating. The resulting high-power detected signal provides the highest signal-to-noise ratio among dynamic light-scattering (DLS) technologies. 1.3 This combined, amplified, optical signal is converted with a Fast Fourier transform (FFT) into a frequency power spectrum, then into a logarithmic power spectrum that is deconvolved into number and volume size distributions. The mean intensity, polydispersity, number and volume size distributions, concentration, and molecular weight can be reported in all platforms, plus zeta potential on Platform C. 1.4 This technology is capable of measuring nanoparticles in a size range from 2.0 nanometres (nm) to 10 micrometres (µm), at concentrations in a suspending liquid medium up to 40 % cc/mL for all parameters given in 1.3. 1.5 Units...
SIGNIFICANCE AND USE 4.1 In this guide, the conditions, measurement apparatus, and procedures for measuring several characteristics of nanoparticle properties on three different instrument platforms using laser-amplified detection/power spectrum analysis (LAD/PSA) technology are described. This is a more recently developed technology, commercialized in 1990, than the older technology known as either photon correlation spectroscopy (PCS) or quasi-elastic light scattering (QLS)—those titles are interchangeable—developed first in 1961. Nanoparticle tracking analysis (NTA) is the most recent DLS technology to be commercialized. All three of these technologies fall under the broader category of DLS, based on the “dynamic” movement of the measured nanoparticles under Brownian motion. 4.2 DLS in the lower end of the nanometre size range becomes progressively more difficult as the particle optical scattering coefficients drop sharply, reducing the scattered light intensity. The advantage of the heterodyne detection mode over the homodyne detection mode, especially at the low end of the nanometre range, will be explained. 4.3 The LAD/PSA technology will be described and the major differences between it and the PCS-QLS and NTA technologies will be made clear. For thorough discussions of PCS-QLS, refer to Guide E2490, Test Method E3247, and ISO 22412 Annex Section A.1. For a thorough discussion of nanoparticle tracking analysis (NTA), refer to Guide E2834. For detailed information on laser-amplified detection/frequency power spectrum (LAD/FPS) technology, refer to ISO 22412 Annex Section A.2. General information on particle characterization practices can be found in Practice E1817, and nanotechnology terminology is given in Terminology E2456. Detailed information on sampling for particle characterization can be found in ISO 14488. SCOPE 1.1 The technology, laser-amplified detection/power spectrum analysis (LAD/PSA), is available in three different platforms, which will be designated as Platforms A, B, and C. 1.1.1 Platform A—This is a solid-state probe configuration that serves as the optical bench in each of the platforms. It consists of an optical fiber coupler with a y-beam splitter that directs the scattered light signal from the nanoparticles at 180° back to a photodiode detector. The sensing end of the probe can be immersed in a suspension or positioned to measure one drop of a sample on top of the sensing surface. 1.1.2 Platform B—The same probe is mounted in a case, positioned horizontally, to detect the signal from either a disposable or permanent cuvette. 1.1.3 Platform C—Two probes are mounted in a case, horizontally, at opposite sides of a permanent sample cell. Both size distribution and zeta potential can be measured in this configuration. 1.2 The laser beam travelling through the probe measuring the scattered light from the sample of nanoparticles, in all three platforms, is partially reflected back to the same photodiode detector, and the high optical power of the laser is added to the low optical power of the scattered light signal. The interference (mixing or beating) of those two signals is known as heterodyne beating. The resulting high-power detected signal provides the highest signal-to-noise ratio among dynamic light-scattering (DLS) technologies. 1.3 This combined, amplified, optical signal is converted with a Fast Fourier transform (FFT) into a frequency power spectrum, then into a logarithmic power spectrum that is deconvolved into number and volume size distributions. The mean intensity, polydispersity, number and volume size distributions, concentration, and molecular weight can be reported in all platforms, plus zeta potential on Platform C. 1.4 This technology is capable of measuring nanoparticles in a size range from 2.0 nanometres (nm) to 10 micrometres (µm), at concentrations in a suspending liquid medium up to 40 % cc/mL for all parameters given in 1.3. 1.5 Units...
ASTM E3427-24 is available in PDF format for immediate download after purchase. The document can be added to your cart and obtained through the secure checkout process. Digital delivery ensures instant access to the complete standard document.
Standards Content (Sample)
This international standard was developed in accordance with internationally recognized principles on standardization established in the Decision on Principles for the
Development of International Standards, Guides and Recommendations issued by the World Trade Organization Technical Barriers to Trade (TBT) Committee.
Designation: E3427 − 24
Standard Guide for
Measuring Intensity, Polydispersity, Size, Zeta Potential,
Molecular Weight, and Concentration of Nanoparticles in
Liquid Suspension Using Laser-Amplified Detection/Power
Spectrum Analysis (LAD/PSA) Technology
This standard is issued under the fixed designation E3427; the number immediately following the designation indicates the year of
original adoption or, in the case of revision, the year of last revision. A number in parentheses indicates the year of last reapproval. A
superscript epsilon (´) indicates an editorial change since the last revision or reapproval.
1. Scope distributions, concentration, and molecular weight can be
reported in all platforms, plus zeta potential on Platform C.
1.1 The technology, laser-amplified detection/power spec-
1.4 This technology is capable of measuring nanoparticles
trum analysis (LAD/PSA), is available in three different
in a size range from 2.0 nanometres (nm) to 10 micrometres
platforms, which will be designated as Platforms A, B, and C.
(μm), at concentrations in a suspending liquid medium up to
1.1.1 Platform A—This is a solid-state probe configuration
40 % cc ⁄mL for all parameters given in 1.3.
that serves as the optical bench in each of the platforms. It
consists of an optical fiber coupler with a y-beam splitter that
1.5 Units—The values stated in SI units are to be regarded
directs the scattered light signal from the nanoparticles at 180°
as the standard. No other units of measurement are included in
back to a photodiode detector. The sensing end of the probe can
this standard.
be immersed in a suspension or positioned to measure one drop
1.6 This standard does not purport to address all of the
of a sample on top of the sensing surface.
safety concerns, if any, associated with its use. It is the
1.1.2 Platform B—The same probe is mounted in a case,
responsibility of the user of this standard to establish appro-
positioned horizontally, to detect the signal from either a
priate safety, health, and environmental practices and deter-
disposable or permanent cuvette.
mine the applicability of regulatory limitations prior to use.
1.1.3 Platform C—Two probes are mounted in a case,
1.7 This international standard was developed in accor-
horizontally, at opposite sides of a permanent sample cell. Both
dance with internationally recognized principles on standard-
size distribution and zeta potential can be measured in this
ization established in the Decision on Principles for the
configuration.
Development of International Standards, Guides and Recom-
mendations issued by the World Trade Organization Technical
1.2 The laser beam travelling through the probe measuring
Barriers to Trade (TBT) Committee.
the scattered light from the sample of nanoparticles, in all three
platforms, is partially reflected back to the same photodiode
2. Referenced Documents
detector, and the high optical power of the laser is added to the
2.1 ASTM Standards:
low optical power of the scattered light signal. The interference
(mixing or beating) of those two signals is known as hetero- E1817 Practice for Controlling Quality of Radiological Ex-
amination by Using Representative Quality Indicators
dyne beating. The resulting high-power detected signal pro-
vides the highest signal-to-noise ratio among dynamic light- (RQIs)
E2456 Terminology Relating to Nanotechnology
scattering (DLS) technologies.
E2490 Guide for Measurement of Particle Size Distribution
1.3 This combined, amplified, optical signal is converted
of Nanomaterials in Suspension by Photon Correlation
with a Fast Fourier transform (FFT) into a frequency power
Spectroscopy (PCS)
spectrum, then into a logarithmic power spectrum that is
E2834 Guide for Measurement of Particle Size Distribution
deconvolved into number and volume size distributions. The
of Nanomaterials in Suspension by Nanoparticle Tracking
mean intensity, polydispersity, number and volume size
Analysis (NTA)
E3247 Test Method for Measuring the Size of Nanoparticles
This guide is under the jurisdiction of ASTM Committee E29 on Particle and
Spray Characterization and is the direct responsibility of Subcommittee E29.02 on For referenced ASTM standards, visit the ASTM website, www.astm.org, or
Non-Sieving Methods. contact ASTM Customer Service at service@astm.org. For Annual Book of ASTM
Current edition approved Feb. 1, 2024. Published February 2024. DOI: 10.1520/ Standards volume information, refer to the standard’s Document Summary page on
E3427-24. the ASTM website.
Copyright © ASTM International, 100 Barr Harbor Drive, PO Box C700, West Conshohocken, PA 19428-2959. United States
E3427 − 24
in Aqueous Media Using Dynamic Light Scattering much greater optical power than the optical power of the
scattered light from the nanoparticles.
2.2 ISO Standards:
ISO 14488 Particulate Material—Sampling and Sample
3.2.5 homodyne (self-beating), adj—sinusoidal electromag-
Splitting for the Determination of Particulate Properties
netic waves are generated, as related to DLS, from all the
ISO 22412 Particle Size Analysis—Dynamic Light Scatter-
different pairs of nanoparticles in the scattering region of the
ing (DLS)
incident laser signal representing the sum of the scattered light
intensity for each pair added together (refer to homodyne
3. Terminology
diagram in Fig. 1).
3.1 Definitions—For definitions of terms pertaining to this
3.2.6 y-splitter, n—location in a fiber optic coupler where a
guide not otherwise listed in 3.2, reference should be made to
single beam is divided into two beams and where two beams
ISO 22412, Guides E2490 and E2834, and Test Method E3247.
are combined into one.
3.2 Definitions of Terms Specific to This Standard:
3.3 Acronyms:
3.2.1 deconvolution, n—iterative computational technique
3.3.1 CWV—constant water volume
that calculates an estimate of the answer to a problem.
3.2.1.1 Discussion—The error between the problem and the
3.3.2 DI—deionized
estimate is calculated and the estimate is refined. The process
3.3.3 DLS—dynamic light scattering
is repeated until the error is minimized to a desired minimal
value.
3.3.4 FPS—frequency power spectrum
3.2.2 Fast Fourier transform, FFT, n—algorithm that con-
3.3.5 IPA—isopropyl alcohol
verts a signal from the amplitude/time domain to the
3.3.6 LAD/PSA—laser-amplified detection/power spectrum
amplitude/frequency domain.
analysis
3.2.3 fiber optic coupler, n—fiber optic device capable of
combining two or more inputs into a single output and also
3.3.7 LI—loading index
dividing a single input into two or more outputs.
3.3.8 MI—mean intensity
3.2.4 heterodyne (reference beating), adj—heterodyne de-
3.3.9 MW—molecular weight
tection is the mixing of scattered light from nanoparticles with
a reference light beam from the same source, which is a laser
3.3.10 NTA—nanoparticle tracking analysis
in this technology (refer to heterodyne diagram in Fig. 1).
3.3.11 PCS—photon correlation spectroscopy
3.2.4.1 Discussion—Sinusoidal electromagnetic waves are
generated, as related to dynamic light scattering (DLS), from
3.3.12 PI—polydispersity index
each nanoparticle in the scattering region of the incident laser
3.3.13 PSA—power spectrum analysis
signal. The intensity of the scattered light from each nanopar-
3.3.14 PSD—power spectrum distribution
ticle is added to the intensity of the laser reference beam of
3.3.15 QLS—quasi-elastic light scattering
3.3.16 RI—refractive index
Available from International Organization for Standardization (ISO), ISO
Central Secretariat, Chemin de Blandonnet 8, CP 401, 1214 Vernier, Geneva,
3.3.17 RRI—relative refractive index
Switzerland, https://www.iso.org.
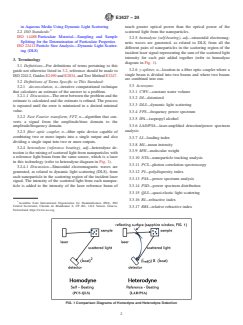
FIG. 1 Comparison Diagrams of Homodyne and Heterodyne Detection
E3427 − 24
4. Significance and Use concentration, molecular weight, and zeta potential of nanopar-
ticles in a liquid undergoing Brownian motion. Brownian
4.1 In this guide, the conditions, measurement apparatus,
motion refers to the random movement displayed by small
and procedures for measuring several characteristics of nan-
particles that are suspended in fluids being struck by the
oparticle properties on three different instrument platforms
molecules in solution as a function of the temperature and
using laser-amplified detection/power spectrum analysis
viscosity of the fluid. This motion is a result of the collisions of
(LAD/PSA) technology are described. This is a more recently
the particles with the random movement of the molecules in the
developed technology, commercialized in 1990, than the older
fluid. LAD uses heterodyne detection. PCS-QLS uses homo-
technology known as either photon correlation spectroscopy
dyne detection. PCS-QLS uses time-based autocorrelation to
(PCS) or quasi-elastic light scattering (QLS)—those titles are
process the detected homodyne signal. LAD/PSA uses power
interchangeable—developed first in 1961. Nanoparticle track-
spectrum analysis to process the detected heterodyne signal.
ing analysis (NTA) is the most recent DLS technology to be
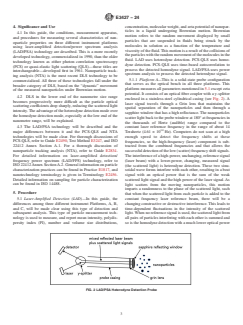
5.1.1 Platform A—This is a solid-state probe configuration
commercialized. All three of these technologies fall under the
that serves as the optical bench in all three platforms. This
broader category of DLS, based on the “dynamic” movement
platform measures all parameters mentioned in 5.1 except zeta
of the measured nanoparticles under Brownian motion.
potential. It consists of an optical fiber coupler with a y-splitter
4.2 DLS in the lower end of the nanometre size range
enclosed in a stainless-steel cylindrical casing (see Fig. 2). A
becomes progressively more difficult as the particle optical
laser signal travels through a Grin lens that maintains the
scattering coefficients drop sharply, reducing the scattered light
spatial separation of the nanoparticles and then through a
intensity. The advantage of the heterodyne detection mode over
sapphire window that has a high reflectance. The nanoparticles
the homodyne detection mode, especially at the low end of the
scatter light back to the probe window at 180° at frequencies in
nanometre range, will be explained.
the thousands of Hertz (audible) range compared to the
4.3 The LAD/PSA technology will be described and the constant laser reference frequency in the range of about 14
major differences between it and the PCS-QLS and NTA
Terahertz (4.61 × 10 Hz). Computers do not scan at a high
technologies will be made clear. For thorough discussions of enough speed to detect the frequency shifts at these
PCS-QLS, refer to Guide E2490, Test Method E3247, and ISO
frequencies, so the high-frequency (laser) component is sub-
22412 Annex Section A.1. For a thorough discussion of tracted from the combined frequencies and that allows the
nanoparticle tracking analysis (NTA), refer to Guide E2834.
successful detection of the low (scatter) frequency shift signals.
For detailed information on laser-amplified detection/ The interference of a high-power, unchanging, reference signal
frequency power spectrum (LAD/FPS) technology, refer to
(laser beam) with a lower-power, changing, measured signal
ISO 22412 Annex Section A.2. General information on particle (the scattered light) is heterodyne detection. These two sinu-
characterization practices can be found in Practice E1817, and
soidal wave forms interfere with each other, resulting in a beat
nanotechnology terminology is given in Terminology E2456. signal with an optical power that is the sum of the weak
Detailed information on sampling for particle characterization
scattered light signal and the high power of the laser signal. As
can be found in ISO 14488. light scatters from the moving nanoparticles, this motion
imparts a randomness to the phase of the scattered light, such
5. Procedure
that when the scattered light from each particle is added to the
5.1 Laser-Amplified Detection (LAD)—In this guide, the
constant frequency laser reference beam, there will be a
differences among three different instrument Platforms, A, B, changing constructive or destructive interference. This leads to
and C, will be made clear using this type of detection and time-dependent fluctuations in the intensity of the scattered
subsequent analysis. This type of particle measurement tech- light. When no reference signal is used, the scattered light from
nology is used to measure, and report mean intensity, polydis- all pairs of particles interfering with each other is summed and
persity index (PI), number and volume size distributions, so is the homodyne detection with a much lower optical power
FIG. 2 LAD/PSA Heterodyne Detection Probe
E3427 − 24
compared to that for heterodyne detection. The two optical 5.1.3 Platform C—Two probes are placed such that the
fibers that couple at the y-splitter (laser beam and scattered windows of the probes are within the walls, on opposite sides,
light signal) are connected to a case containing the laser and of a permanent sample cell. This platform measures all
detector electronics. parameters in 5.1. It is the only platform that also measures
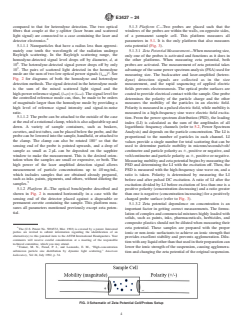
5.1.1.1 Nanoparticles that have a radius less than approxi- zeta potential (Fig. 3).
mately one tenth the wavelength of the radiation undergo
5.1.3.1 Zeta Potential Measurement—When measuring size,
Rayleigh scattering. In the Rayleigh scattering range, the
only one of the probes is activated and functions as it does in
homodyne-detected signal level drops off by diameter, d, at the other platforms. When measuring zeta potential, both
10 . The heterodyne-detected signal power drops off by only
probes are activated. The measurement of zeta potential takes
10 . The pairs of scattered light detected in the homodyne advantage of the same power spectrum analysis (PSA) used for
mode are the sum of two low optical power signals (i ) . See
measuring size. The backscatter and laser-amplified (hetero-
scat
Fig. 2 for diagrams of both the homodyne and heterodyne dyne) detection signals are collected as in the size
detection methods. The signal detected in the heterodyne mode
measurement, and the rapid sequencing of applied electric
is the sum of the mixed scattered light signal and the fields prevents electroosmosis. The optical probe surfaces are
high-power reference signal, (i ) × (i ). The signal level for
coated to provide electrical contact with the sample. One probe
ref0 scat
the controlled reference mode can, thus, be made to be orders
determines the polarity of the particle charge and the other
of magnitude larger than the homodyne mode by providing a
measures the mobility of the particles in an electric field.
high level of reference signal intensity and signal-to-noise
Polarity is measured in a pulsed electric field, while mobility is
ratio.
measured in a high-frequency sine wave electric field excita-
5.1.1.2 The probe can be attached to the outside of the case
tion. From the power spectrum distribution (PSD), the loading
at the end of a rotational clamp, which is also adjustable up and
index (LI) is calculated as the sum of the amplitudes of all
down. A variety of sample containers, such as beakers,
logarithmic frequency channels (refer to 5.2, Power Spectrum
cuvettes, and test tubes, can be placed below the probe, and the
Analysis) and depends on the particle concentration. The LI is
probe can be lowered into the sample, handheld, or attached to
proportional to the number of particles in each channel. LI
the clamp. The clamp can also be rotated 180° so that the
values provide a single number for total scattering that can be
sensing end of the probe is pointed upwards, and a drop of
used to determine particle mobility in microns/seconds/volt/
sample as small as 2 μL can be deposited on the sapphire centimetre and particle polarity as 6, positive or negative, and
window to make the measurement. This is the desired orien-
volt/centimetre and particle polarity as 6, positive or negative.
tation when the samples are small or expensive, or both. The Measuring mobility and zeta potential begins by measuring the
high power of the laser amplified detection signal allows
PSD and determining the LI with the excitation off. Then, the
measurement of particle concentrations up to 40 mg ⁄mL, PSD is measured with the high-frequency sine wave on, and a
which includes samples that are obtained already prepared,
ratio is taken. Polarity is determined by measuring the LI
such as inks. paints, pigments, and others, without diluting the before and after pulsed DC excitation. A ratio of LI after the
samples.
excitation divided by LI before excitation of less than one is a
5.1.2 Platform B—The optical bench/probe described and
positive polarity (concentration decreasing) and a ratio greater
shown in Fig. 2 is mounted horizontally in a case with the
than one is negative (concentration increasing) for a positively
sensing end of the detector placed against a d
...