

ISO/DTS 25008-1.2
(Main)Soil quality — Responses of higher plants to environmental stresses — Part 1: Methods to assess physiological parameters
- Abstract
This technical specification describes a set of physiological (Part 1) and biochemical (Part 2) parameters allowing to measure sublethal effects in higher plants exposed to soil pollutants. It is applicable to soils of unknown quality e.g. from contaminated sites, amended soils or soils after remediation either in situ or laboratory exposure assays. For in situ experiments the areas to compare shall be exposed to the same climatic conditions (humidity, temperature, sunlight). This part specifies a toolbox of methods for analysing variations in physiological parameters and oxidative balance that may be indicative of stress symptoms in higher plants, either monocotyledonous and dicotyledonous species.
- Status
- Not Published
- Technical Committee
- ISO/TC 190/SC 4 - Biological characterization
- Drafting Committee
- ISO/TC 190/SC 4/WG 3 - Effects on soil flora
- Current Stage
- 5020 - FDIS ballot initiated: 2 months. Proof sent to secretariat
- Start Date
- 16-Sep-2026
- Completion Date
- 16-Sep-2026
Buy Documents


ISO/DTS 25008-1.2 - Soil quality — Responses of higher plants to environmental stresses — Part 1: Methods to assess physiological parameters
REDLINE ISO/DTS 25008-1.2 - Soil quality — Responses of higher plants to environmental stresses — Part 1: Methods to assess physiological parameters


ISO/DTS 25008-1 - Soil quality — Responses of higher plants to environmental stresses — Part 1: Physiological parameters

REDLINE ISO/DTS 25008-1 - Soil quality — Responses of higher plants to environmental stresses — Part 1: Physiological parameters
ISO/DTS 25008-1.2 is an ISO technical specification for soil quality assessment using higher plants. It specifies four leaf-based methods - malondialdehyde (MDA), electrolyte leakage, relative water content (C_RW), and proline content - to detect sublethal physiological stress in monocotyledonous and dicotyledonous plants exposed to polluted or otherwise stressed soils. It is intended for use on soils of unknown quality, including contaminated, amended, and remediated soils, in situ or in laboratory exposure assays.
What does ISO/DTS 25008-1.2 specify?
ISO/DTS 25008-1.2 specifies a toolbox of methods for measuring physiological responses in higher plants exposed to soil pollutants and other stressors. In practice, it gives users a common way to compare stressed plants with negative controls or reference conditions, so the results can be interpreted across sites, treatments, and sampling times.
The document is organized into clauses for scope, references, terms, principle, reagents and materials, plants and sampling, the four test methods, data analysis and interpretation, and the test report. Annex A provides a short method summary with tables and figures for quick use.
What are the key requirements of ISO/DTS 25008-1.2?
Applicability and test conditions
ISO/DTS 25008-1.2 applies to soils of unknown quality, such as contaminated sites, amended soils, and soils after remediation. It can be used in situ or in laboratory exposure assays, and for field comparisons the areas under study should have the same climatic conditions - humidity, temperature, and sunlight. That matters because the plant response should reflect soil stress, not a different microclimate.
The document is aimed at higher plants, including monocotyledonous and dicotyledonous species, and it can be used with crop plants and trees. It is intended to detect sublethal effects, so the reader is looking for physiological stress before obvious plant failure appears.
Sampling and leaf selection
ISO/DTS 25008-1.2 asks users to sample leaves in a controlled way. In laboratory or greenhouse work, at least five leaves or leaf pieces, one per plant replicate, are used per treatment and sampling time. In site studies, the document calls for sampling at least five individuals per species per area, with reference or comparison areas where relevant.
The leaf selection rules matter in practice: harvest green, mature leaves, avoid leaves already under drought or pathogen stress, use plants of similar size, and sample the same part of the leaf across individuals. Harvesting should be done within 2 to 3 hours. These steps reduce noise in the data and make treatment differences easier to interpret.
The four physiological methods
ISO/DTS 25008-1.2 focuses on four measurements in leaf material. MDA and proline are measured by spectrophotometry, electrolyte leakage by conductivity, and relative water content from weight changes. The document recommends using the four methods together, because each one reflects a different aspect of plant stress.
- MDA content - Clause 7.2 uses a TCA/TBA colorimetric method and reads absorbance at 532 nm and 600 nm. The result is a marker of lipid peroxidation, so it helps indicate oxidative damage to cell membranes.
- Electrolyte leakage - Clause 7.3 measures conductivity before and after incubation, then after autoclaving. This shows membrane injury or loss of integrity, which is useful for comparing contaminated or otherwise stressful conditions.
- Relative water content - Clause 7.4 uses fresh, turgid, and dry weights. It reflects the water status of the leaf and is noted as especially suitable for dicotyledonous species.
- Proline content - Clause 7.5 uses the ninhydrin-toluene method with absorbance at 520 nm. Proline is an osmolyte, so its increase can point to stress tolerance responses and metabolic adjustment.
Controls, calibration, and calculations
ISO/DTS 25008-1.2 uses blank controls and, where relevant, negative control conditions. Clause 3 defines these terms, and the methods call for blanks in the MDA and proline procedures. Standard curves are required for MDA and proline, using TMP for MDA and L-proline for proline. This matters because the document allows either direct calculation or calibration-based quantification, depending on the method.
The formulas in Clause 7 convert raw readings into reported values per unit leaf mass. Clause 8 then asks users to report averages and standard deviations, and to test differences with appropriate statistics such as a t-test, one-way ANOVA, repeated measures ANOVA, and post-hoc tests like Dunnett’s or Tukey’s tests. The document also recommends reference soils or areas and negative controls to support meaningful comparisons.
Reporting
Clause 9 lists the information that should appear in the test report. That includes the plant species, growth stage, visible damage, experimental design, soil characterization, treatments, controls and blanks, leaf mass or fragment size, procedure details, preliminary adjustment data, statistical treatment, and plots for the four physiological parameters. In practice, this gives a buyer, lab, or auditor enough context to understand how the results were obtained.
What terms does ISO/DTS 25008-1.2 define?
- Blank control - A technical treatment used to check procedure performance and reagent quality.
- Negative control condition - The optimum plant condition used as the comparison baseline.
- Stress condition - The environmental stress treatment being studied, such as contaminated soil or drought.
- Treatment - Any test condition considered in the study, including negative control and stress conditions.
- Reading blank - A measurement used to set the spectrophotometer to zero optical density.
Who uses ISO/DTS 25008-1.2?
ISO/DTS 25008-1.2 is used by soil and plant testing laboratories, environmental consultants, remediation teams, agronomists, and researchers in soil quality and plant stress physiology. It is also relevant to quality managers and buyers who need a defined way to compare reference soil with contaminated, amended, or remediated soil.
Typical tasks include site monitoring, phytocenosis assessment, site-specific risk assessment, greenhouse trials, and laboratory exposure assays. It is also useful where a plant-based response is needed alongside chemical soil data.
Which standards are used with ISO/DTS 25008-1.2?
ISO 11074, Soil quality - Vocabulary, is the normative reference used for the terms and definitions in Clause 3. It provides the shared soil vocabulary that supports consistent interpretation.
ISO/TS 25008-2 is the companion part named in the document series. It covers methods to assess enzyme activities of the antioxidant defence system, and it can be combined with Part 1 when a broader biological picture is needed.
What does the ISO/DTS 25008-1.2 document contain?
ISO/DTS 25008-1.2 contains detailed procedures for preparing reagents, selecting equipment, sampling leaves, and running the four physiological assays. It includes calculation formulas for MDA, electrolyte leakage, relative water content, and proline content, along with two calibration schemes for TMP and L-proline.
The document also includes an interpretation aid in Table 3, which gives literature-based indicative trends for the four parameters in stressed versus unstressed plants. Annex A summarizes each method in tables and figures, which is useful for routine laboratory work or training.
Clause 9 gives a structured test-report list, so the document is not just a method description but also a reporting framework. That makes it suitable for monitoring programs, comparison studies, and documented plant-response assessments.
Buy Documents
ISO/DTS 25008-1.2 - Soil quality — Responses of higher plants to environmental stresses — Part 1: Methods to assess physiological parameters
REDLINE ISO/DTS 25008-1.2 - Soil quality — Responses of higher plants to environmental stresses — Part 1: Methods to assess physiological parameters
ISO/DTS 25008-1 - Soil quality — Responses of higher plants to environmental stresses — Part 1: Physiological parameters
REDLINE ISO/DTS 25008-1 - Soil quality — Responses of higher plants to environmental stresses — Part 1: Physiological parameters
Get Certified
Connect with accredited certification bodies for this standard

Control Union Certifications
Global certification for agriculture and sustainability.

ECOCERT
Organic and sustainability certification.

FSC International
Forest Stewardship Council certification.
Sponsored listings
Frequently Asked Questions
ISO/DTS 25008-1.2 is a draft published by the International Organization for Standardization (ISO). Its full title is "Soil quality — Responses of higher plants to environmental stresses — Part 1: Methods to assess physiological parameters". This standard covers: This technical specification describes a set of physiological (Part 1) and biochemical (Part 2) parameters allowing to measure sublethal effects in higher plants exposed to soil pollutants. It is applicable to soils of unknown quality e.g. from contaminated sites, amended soils or soils after remediation either in situ or laboratory exposure assays. For in situ experiments the areas to compare shall be exposed to the same climatic conditions (humidity, temperature, sunlight). This part specifies a toolbox of methods for analysing variations in physiological parameters and oxidative balance that may be indicative of stress symptoms in higher plants, either monocotyledonous and dicotyledonous species.
This technical specification describes a set of physiological (Part 1) and biochemical (Part 2) parameters allowing to measure sublethal effects in higher plants exposed to soil pollutants. It is applicable to soils of unknown quality e.g. from contaminated sites, amended soils or soils after remediation either in situ or laboratory exposure assays. For in situ experiments the areas to compare shall be exposed to the same climatic conditions (humidity, temperature, sunlight). This part specifies a toolbox of methods for analysing variations in physiological parameters and oxidative balance that may be indicative of stress symptoms in higher plants, either monocotyledonous and dicotyledonous species.
ISO/DTS 25008-1.2 is classified under the following ICS (International Classification for Standards) categories: 13.080.05 - Examination of soils in general; 65.020.20 - Plant growing. The ICS classification helps identify the subject area and facilitates finding related standards.
ISO/DTS 25008-1.2 is available in PDF format for immediate download after purchase. The document can be added to your cart and obtained through the secure checkout process. Digital delivery ensures instant access to the complete standard document.
Standards Content (Sample)
FINAL DRAFT
Technical
Specification
ISO/TC 190/SC 4
Soil quality — Responses of higher
Secretariat: AFNOR
plants to environmental stresses —
Voting begins on:
2026-09-16
Part 1:
Methods to assess physiological
Voting terminates on:
2026-11-11
parameters
Qualité du sol — Réponses des végétaux supérieurs aux
contraintes environnementales —
Partie 1: Méthodes d'évaluation des paramètres physiologiques
RECIPIENTS OF THIS DRAFT ARE INVITED TO SUBMIT,
WITH THEIR COMMENTS, NOTIFICATION OF ANY
RELEVANT PATENT RIGHTS OF WHICH THEY ARE AWARE
AND TO PROVIDE SUPPOR TING DOCUMENTATION.
IN ADDITION TO THEIR EVALUATION AS
BEING ACCEPTABLE FOR INDUSTRIAL, TECHNO-
LOGICAL, COMMERCIAL AND USER PURPOSES, DRAFT
INTERNATIONAL STANDARDS MAY ON OCCASION HAVE
TO BE CONSIDERED IN THE LIGHT OF THEIR POTENTIAL
TO BECOME STAN DARDS TO WHICH REFERENCE MAY BE
MADE IN NATIONAL REGULATIONS.
Reference number
FINAL DRAFT
Technical
Specification
ISO/TC 190/SC 4
Soil quality — Responses of higher
Secretariat: AFNOR
plants to environmental stresses —
Voting begins on:
Part 1:
Methods to assess physiological
Voting terminates on:
parameters
RECIPIENTS OF THIS DRAFT ARE INVITED TO SUBMIT,
WITH THEIR COMMENTS, NOTIFICATION OF ANY
RELEVANT PATENT RIGHTS OF WHICH THEY ARE AWARE
AND TO PROVIDE SUPPOR TING DOCUMENTATION.
© ISO 2026
IN ADDITION TO THEIR EVALUATION AS
All rights reserved. Unless otherwise specified, or required in the context of its implementation, no part of this publication may
BEING ACCEPTABLE FOR INDUSTRIAL, TECHNO-
LOGICAL, COMMERCIAL AND USER PURPOSES, DRAFT
be reproduced or utilized otherwise in any form or by any means, electronic or mechanical, including photocopying, or posting on
INTERNATIONAL STANDARDS MAY ON OCCASION HAVE
the internet or an intranet, without prior written permission. Permission can be requested from either ISO at the address below
TO BE CONSIDERED IN THE LIGHT OF THEIR POTENTIAL
or ISO’s member body in the country of the requester.
TO BECOME STAN DARDS TO WHICH REFERENCE MAY BE
MADE IN NATIONAL REGULATIONS.
ISO copyright office
CP 401 • Ch. de Blandonnet 8
CH-1214 Vernier, Geneva
Phone: +41 22 749 01 11
Email: copyright@iso.org
Website: www.iso.org
Published in Switzerland Reference number
ii
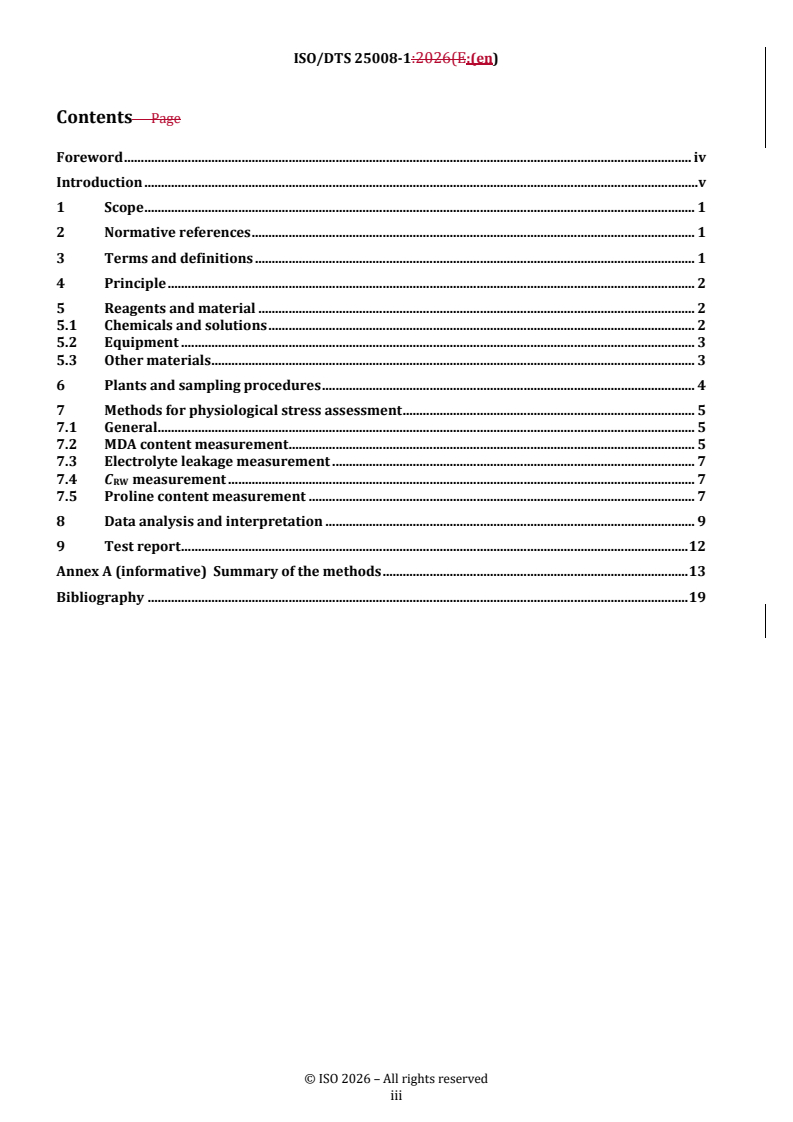
Contents Page
Foreword .iv
Introduction .v
1 Scope . 1
2 Normative references . 1
3 Terms and definitions . 1
4 Principle . 2
5 Reagents and material . 2
5.1 Chemicals and solutions .2
5.2 Equipment .3
5.3 Other materials .3
6 Plants and sampling procedures . 4
7 Methods for physiological stress assessment . 5
7.1 General .5
7.2 Malondialdehyde (MDA) content measurement .5
7.2.1 Procedure to determine MDA levels .5
7.2.2 MDA standard curve .5
7.3 Electrolyte leakage measurement .6
7.4 Relative water content measurement .7
7.5 Proline content measurement.7
7.5.1 Procedure to determine proline levels .7
7.5.2 Proline standard curve .8
8 Data analysis and interpretation . 8
9 Test report .11
Annex A (informative) Summary of the methods .12
Bibliography .16
iii
Foreword
ISO (the International Organization for Standardization) is a worldwide federation of national standards
bodies (ISO member bodies). The work of preparing International Standards is normally carried out through
ISO technical committees. Each member body interested in a subject for which a technical committee
has been established has the right to be represented on that committee. International organizations,
governmental and non-governmental, in liaison with ISO, also take part in the work. ISO collaborates closely
with the International Electrotechnical Commission (IEC) on all matters of electrotechnical standardization.
The procedures used to develop this document and those intended for its further maintenance are described
in the ISO/IEC Directives, Part 1. In particular, the different approval criteria needed for the different types
of ISO documents should be noted. This document was drafted in accordance with the editorial rules of the
ISO/IEC Directives, Part 2 (see www.iso.org/directives).
ISO draws attention to the possibility that the implementation of this document may involve the use of (a)
patent(s). ISO takes no position concerning the evidence, validity or applicability of any claimed patent
rights in respect thereof. As of the date of publication of this document, ISO had not received notice of (a)
patent(s) which may be required to implement this document. However, implementers are cautioned that
this may not represent the latest information, which may be obtained from the patent database available at
www.iso.org/patents. ISO shall not be held responsible for identifying any or all such patent rights.
Any trade name used in this document is information given for the convenience of users and does not
constitute an endorsement.
For an explanation of the voluntary nature of standards, the meaning of ISO specific terms and expressions
related to conformity assessment, as well as information about ISO’s adherence to the World Trade
Organization (WTO) principles in the Technical Barriers to Trade (TBT), see www.iso.org/iso/foreword.html.
This document was prepared by Technical Committee ISO/TC 190, Soil quality, Subcommittee SC 4, Biological
characterization.
A list of all parts in the ISO/TS 25008 series can be found on the ISO website.
Any feedback or questions on this document should be directed to the user’s national standards body. A
complete listing of these bodies can be found at www.iso.org/members.html.
iv
Introduction
Higher plants are important organisms in terrestrial ecosystems and are often exposed to different types
of environmental stressors. These stressors can induce genetic, metabolic and physiological perturbations
in plants. Within ISO/TC 190/SC 4, there are currently a few standardized methods available to assess these
perturbations, mainly based on developmental traits: germination (ISO 18763); emergence of seedlings
(ISO 17126); plant growth (ISO 11269-1 and ISO 11269-2, root growth and early growth, respectively); and
chronic toxicity (ISO 22030). Only two standards address specific parameters, i.e. genotoxicity (ISO 29200)
or biochemical parameters for leaf fatty acid composition (ISO 21479).
In addition to the parameters considered in these standards, the homeostasis of physiological processes
and oxidative biochemical responses in plants can also become impaired when exposed to stressful
environmental conditions. As a result, the resilience and plasticity of plants can be deeply constrained,
thereby affecting their capacity to adapt, survive and thrive in terrestrial ecosystems.
The ISO/TS 25008 series includes two parts describing a set of physiological (ISO/TS 25008-1) and
biochemical (ISO/TS 25008-2) parameters (Figure 1), of which the combined analysis can foster a more
holistic and comprehensive evaluation of the performance of plants exposed to soil pollutants or other
environmental stresses, comparatively to the analysis of isolated parameters.
Figure 1 — Schematic representation of the parameters covered
by the ISO/TS 25008 series
This document details methods for assessing relevant physiological processes in plants, namely associated
with oxidative damage (malondialdehyde content), cell membrane stability or permeability (electrolyte
leakage), plant water relations (relative water content), and metabolic changes (proline content) (Figure 1).
Lipid peroxidation is a process occurring through several reactions in which reactive oxygen species (ROS)
attack unsaturated lipids, causing oxidative injury to plants’ cell membranes and the accumulation of
[18]
several by-products, such as malondialdehyde (MDA) . MDA content has often been reported to increase in
[19][20][21] [22]
consequence of metal contamination , as well as in the presence of other stress-inducing agents ,
hence constituting a good indicator of oxidative stress in plants.
v
The measurement of electrolyte leakage has been also used as an indicator of the structural integrity and
permeability of cell membranes, which can be disrupted by ROS produced under exposure to stress agents,
[19][23] [24] [25] [22]
such as metals , organic contaminants , heat stress and water deficit conditions .
Leaf relative water content (C ) is regularly determined for characterizing plant-water relations, being a
RW
suitable indicator of changes in the water pool of plants that can compromise cellular metabolism. The levels
of C can vary between species and genotypes, and can increase with the accumulation of osmolytes such
RW
[26] [22] [27] [26]
as proline. Leaf C is normally reduced under drought , heat , and salt stresses , but tends to
RW
[19] [28]
increase under metal contamination since metals can influence the water use efficiency by plants .
Plants can produce molecules capable of reducing the impact of unfavourable conditions. The aminoacid
proline is an osmolyte molecule frequently accumulated in higher amounts to enhance plants’ tolerance
[19] [29]
to different stress factors such as metals and other pollutants, salinity and heat stress. Moreover,
the role of proline is multifunctional, as it can scavenge ROS and interfere in cellular oxidative responses,
stabilize cell structures and mediate metabolic pathways activated for compensating the impacts of abiotic
[30]
stresses. Therefore, the analysis of proline content can provide a relevant overview of plant health status,
especially if complemented with the analysis of other biological responses.
Overall, changes (mostly an increase) in MDA content and electrolyte leakage can broadly better contribute
towards the assessment of soil contamination; whereas C and proline levels can often be more responsive
RW
to abiotic stressors in general. Notwithstanding, such a profile can vary according to the plant species and
their tolerance ranges. Therefore, the complementary analyses of these four physiological parameters in
conjunction is highly recommended, as it can provide an improved overview of plant responses to pollutants
and other common environmental changes, often co-occurring in the terrestrial compartment.
vi
FINAL DRAFT Technical Specification ISO/DTS 25008-1.2:2026(en)
Soil quality — Responses of higher plants to environmental
stresses —
Part 1:
Methods to assess physiological parameters
1 Scope
This document describes a set of physiological parameters allowing the measurement of sublethal effects
in higher plants exposed to soil pollutants and other stressors (e.g. drought, nutrient availability, heat
stress). It is applicable to soils of unknown quality (e.g. from contaminated sites, amended soils or soils after
remediation), either in situ or following laboratory exposure assays. This document specifies the methods
for analysing variations in physiological responses and oxidative damage that can be indicative of stress
symptoms in the leaves of higher plants, either monocotyledonous or dicotyledonous species.
2 Normative references
The following documents are referred to in the text in such a way that some or all of their content constitutes
requirements of this document. For dated references, only the edition cited applies. For undated references,
the latest edition of the referenced document (including any amendments) applies.
ISO 11074, Soil quality — Vocabulary
3 Terms and definitions
For the purposes of this document, the terms and definitions given in ISO 11074 and the following apply.
ISO and IEC maintain terminology databases for use in standardization at the following addresses:
— ISO Online browsing platform: available at https:// www .iso .org/ obp
— IEC Electropedia: available at https:// www .electropedia .org/
3.1
blank control
technical treatment (3.4) for evaluating the performance of the procedure and quality of the reagents
3.2
negative control condition
treatment (3.4) consisting of the optimum condition for the physiological performance of the plant
EXAMPLE Sample of a reference soil or a control soil with a mixture of known solutions, to which plants are
exposed.
3.3
stress condition
treatment (3.4) consisting of the environmental stress condition under study
Note 1 to entry: Sample of a diluted and/or undiluted soil subjected to an environmental stress (e.g. contamination,
pollution, drought).
3.4
treatment
condition considered in the test, experiment or study (i.e. negative control, stress condition(s))
3.5
reading blank
measurement done to set the spectrophotometer to zero optical density
4 Principle
This document specifies four methods to determine changes on lipid peroxidation [malondialdehyde (MDA)
content], cell membrane integrity (electrolyte leakage, L ), hydric relations (relative water content, C ),
E RW
and metabolic variations (proline content) in leaf extracts. MDA and proline contents are determined
through spectrophotometric methods, whilst L and C are based, respectively, on conductivity and weight
E RW
changes after a period of incubation under specific conditions. It is highly recommended to conduct the four
methods in conjunction to evaluate changes in the physiological status of plants that can be indicative of
stress symptoms, within different locations or exposure times along a growth period of the plants in the
soils under assessment. These methods are applicable in different experimental frameworks, either in site-
specific monitoring programs, in in situ or laboratory exposure assays. For in situ experiments the areas to
compare shall be exposed to the same climatic conditions (humidity, temperature, sunlight).
5 Reagents and material
5.1 Chemicals and solutions
5.1.1 Trichloroacetic acid (TCA) 0,1 % and 20 % (w/v).
®1)
For preparing 0,1 % (w/v) TCA (CAS Registry Number 76-03-9) dissolve 0,5 g of the reagent in 400 ml
of water, mix to solubilize, and make up the volume to 500 ml in a volumetric flask. Store the solution at
(4 ± 1) °C protected from light. Remove the solution from the cooler approximately 30 minutes before use to
warm up to room temperature.
5.1.2 Solution of TCA 20 % / Thiobarbituric acid (TBA) 0,5 % (w/v).
Dissolve 100 g of TCA in 250 ml of water by heating at (40 ± 2) °C covered with aluminium foil until complete
solubilization of the reagent. Cool down the solution to room temperature.
‒1
Dissolve 2,5 g of TBA (CAS: 504-17-6) in approximately 5-10 ml of sodium hydroxide 0,1 mol l (CAS 1310-
73-2). Add approximately 50 ml of water, mix, and add to the 20 % TCA solution initially prepared. Heat the
mixture at (40 ± 2) °C in the dark until complete dissolution. Cool down the solution and then make up the
volume to 500 ml. Store the TBA-TCA solution at (4 ± 1) °C up to 1 week in the dark or freeze at (‒20 ± 1) °C
for longer periods of storage.
5.1.3 Water.
Sterilized [at (121 ± 1) °C and 15 psi for 20 minutes] or non-sterilized, as specified in the respective methods,
‒1
with a conductivity of (0,06 ± 0,02) µS cm (i.e. ultrapure water; recommended for electrolyte leakage)
‒1
or < 5 µS cm (i.e. distilled water; can be applied in the other methods).
5.1.4 MDA standard (1,1,3,3-Tetramethoxypropane, TMP).
MDA is not a stable molecule, but TMP (CAS 102-52-3) can be converted into MDA by acidic hydrolysis,
‒1 ‒1
thereby being used as an MDA standard. Prepare a standard stock solution of 1 mg ml (or 6,09 µmol ml )
1) Chemical Abstracts Service (CAS) Registry Number® is a trademark of the American Chemical Society (ACS). This
information is given for the convenience of users of this document and does not constitute an endorsement by ISO of the
product named. Equivalent products may be used if they can be shown to lead to the same results.
‒1
by adding 10 µl of TMP to 10 ml of 0,1 mol l HCl. The stock solution can be stored at (4 ± 1) °C protected
‒1 ‒1
from light up to one week. A working solution of 10 µg ml (or 60,9 nmol ml ) should be freshly prepared
before doing the standard curve by diluting 100 µl of the stock solution in 9,90 ml of water.
5.1.5 Sulfosalicylic acid 3 % (m/v).
Dissolve 3 g of 5-sulfosalicylic acid (CAS 5965-83-3; 2-hydroxy-5-sulfobenzoic acid) in 80 ml of water and
make up the volume to 100 ml. Store the solution at room temperature for weeks.
5.1.6 Glacial acetic acid (CAS 64-19-7).
5.1.7 Ninhydrin acid solution.
‒1
Add 1,25 g ninhydrin (CAS 485-47-2) in 30 ml glacial acetic acid (5.1.6) and 20 ml of 6 mol l phosphoric acid
(CAS 7664-38-2), and stir by warming up the solution (approximately 50 °C to 60 °C) until dissolved. Store
the solution at (4 ± 1) °C in the dark for up to 1 week.
5.1.8 Toluene (CAS 108-88-3).
Use the reagent as is.
5.1.9 L-proline standard solutions.
‒1
Prepare a 1 mg ml standard stock solution by dissolving 50 mg of L-proline (CAS 147-85-3) in 50 ml of
water. Make aliquots of 2 ml and store at (–20 ± 1) °C protected from light up to one month. Freshly prepare
‒1 ‒1
a 200 µg ml working solution of L-proline standard, by diluting 1 ml of the 1 mg ml stock solution in 4 ml
of water. Protect the working solution from light and keep it at (4 ± 1) °C until use.
5.2 Equipment
5.2.1 Analytical scale with readability of 0,001 g.
5.2.2 Centrifuge adaptable for microcentrifuge tubes, falcon and/or glass tubes.
5.2.3 Thermostatic water bath.
5.2.4 Spectrophotometer UV-Vis for reading absorbances at 520 nm, 532 nm, and 600 nm.
5.2.5 Orbital shaker.
5.2.6 Conductivity meter.
5.2.7 Autoclave.
5.2.8 Incubator or oven, working up to (70 ± 2) °C.
5.2.9 Vortex.
5.3 Other materials
5.3.1 Mortar and pestle made of porcelain.
5.3.2 Plastic falcon tubes of 14 ml to 15 ml.
5.3.3 Micropipette of 5 000 µl, 1 000 µl, 200 µl, 20 µl and 10 µl, and their respective tips.
5.3.4 Glass test tubes with lid of 10 ml to 14 ml resistant to centrifugation and (100 ± 1) °C incubations.
5.3.5 Glass or quartz cuvettes of 1 ml or 3 ml.
5.3.6 Glass vials with lid of 40 ml (approximately 3 cm diameter × 8 cm height) resistant to autoclaving.
5.3.7 Sterile absorbent paper [sterilization at (121 ± 1) °C and 15 psi for 20 minutes].
5.3.8 Plastic petri dishes with 90 mm of diameter.
5.3.9 Plastic microtubes (i.e. microcentrifuge tubes) of 1,5 ml and 2 ml.
6 Plants and sampling procedures
The described methods can be applied to higher plants, either monocotyledonous or dicotyledonous, for
example crop plants (e.g. corn, tomato, lettuce) and trees (pine, willow, ash, olive).
The methods can be used to assess the plant physiological status either along several sampling time intervals
or at the end of a growth period, or both, under soils which quality is being assessed. The frequency of
sampling depends on the goal, type and experimental set-up (i.e. monitoring program, in situ or laboratory
assay) of the study, as well as the exposure period performed. Seedlings and adult plants resulting from the
performance of different ISO standard tests (e.g. seedling emergence test, chronic toxicity test) can be used,
as far as appropriate controls and control conditions are established during the experiments, for comparison
means.
For assays conducted under controlled conditions (i.e. laboratory and greenhouse experiments), at least
five leaves (or a piece of leaf), one per plant replicate, should be harvested per treatment (e.g. control soil,
soil sample or dilution), parameter or method, and sampling time (if applicable). The amount of leaf tissue
per plant replicate necessary to conduct the 4 measurements or methods can range between 2 g and 3 g,
depending on the type or size of the leaf and on its fresh biomass. Considering that the analytical methods
are invasive, additional plant replicates can be implemented per treatment if several sampling times are
conducted.
For on-site monitoring studies aiming to obtain an overview of the phytocenosis, the larger the number of
species sampled, the more representative the results are of the “soil quality” for the overall phytocenosis.
Hence, in this case, the various areas of the site are firstly prospected, and several species of plants to
sample are chosen among the most representative and, to the extent possible, the more common to all
areas. Nevertheless, for the assessment of agricultural practices, for site-specific risk assessment studies,
or for in situ assays, only one plant species can be of interest and sampled, namely the cultivated crop or the
selected test plant. For risk assessment and in situ assays, a reference versus a contaminated, remediated or
stress-impacted area or soil should be sampled or tested. Irrespective of the on-site study approach, one leaf
(or a piece of leaf) of at least 5 individuals per species is collected per area, by doing the following:
— do not consider leaves under hydric (drought) or biotic (pathogens) stress, only green leaves shall be
harvested;
— harvest leaves on plants of similar size, consequently, harvesting leaves from small plants on one area
and leaves from tall plants on another shall not be undertaken;
— as a precautionary measure, harvest only mature leaves and disregard developing ones;
— when only a part of leaves is sampled from a given species, harvest the same part of the leaves (for
example the distal part) for all individuals;
— as a precautionary measure, harvest all the plants within 2 to 3 hours.
For all experimental approaches, the harvested leaves should be analysed immediately, particularly for MDA
content, L and C . For the analysis of proline content, either use the freshly harvested leaves or, if not
E RW
possible, snap freeze them in liquid nitrogen, and store at (–80 ± 1) °C until initiating the analysis procedure.
7 Methods for physiological stress assessment
7.1 General
The methods detailed in 7.2 to 7.5 are summarized in the Tables A.1 to A.4 and in Figures A.1 to Figure A.4
in Annex A.
7.2 Malondialdehyde (MDA) content measurement
7.2.1 Procedure to determine MDA levels
MDA is a product of lipid peroxidation, which results from the degradation of cell membrane integrity.
Thereby, the MDA content in monocotyledonous or dicotyledonous plant leaves is indicative of the lipid
[31][32]
peroxidation level . The principle of the assay relies on the reaction of one molecule of MDA with
2 molecules of TBA under high temperature, forming the MDA-2TBA adduct of pink colour that is detectable
at 532 nm.
Besides the testing of leaf samples from the different experimental treatments (e.g. negative control and
stress condition) it is recommended to include a blank control of the procedure, in which the leaf extract is
replaced by water (5.1.3).
Homogenize (350 ± 100) mg (use an analytical scale, 5.2.1) of a fresh leaf per plant replicate (from at least
5 plant replicates) in 5 ml of 0,1 % TCA (5.1.1), using a mortar and a pestle (5.3.1). Transfer the homogenate
of leaf extract to a falcon tube (5.3.2) and centrifuge (5.2.2) at 10 000g and (4 ± 1) °C for 10 minutes. Pipette
(5.3.3) 1 ml of the supernatant (or 1 ml of water for the blank control) to a glass test tube with lid (5.3.4)
and add 4 ml of TCA/TBA solution (20 %/0,5 %; 5.1.2). Incubate the mixture at (95 ± 1) °C for 30 minutes
in a water bath (5.2.3) to form the MDA-TBA adduct, and immediately after, cool it down in iced-cold
water. Centrifuge the tubes at 10 000g and (4 ± 1) °C for 10 minutes. The absorbance of the supernatant is
spectrophotometrically measured at 532 nm and 600 nm (5.2.4) in glass or quartz cuvettes (5.3.5).
The MDA equivalent is computed by subtracting the absorbance reading at 600 nm (A ; removing
the influence of turbidity) to that measured at 532 nm (A ), and using a molar extinction coefficient
−1 −1[31]
of ε = 0,155 M cm . The following Formula (1) can be applied:
E = ((A – A ) / 0,155 × l) × F / W (1)
MDA 532 600 D LF
where
‒1
E is equivalents of MDA, expressed in µmol mg ;
MDA
A is absorbance measured at 532 nm or 600 nm;
l is the cuvette width (1 cm);
F is the sample dilution factor (1 if sample is not diluted);
D
W corresponds to the leaf fresh weight (in mg) used for preparing the homogenates.
LF
Alternatively, the MDA concentration can be determined from the standard curve, by replacing the y
(corrected A ) in the equation to derive the x value (MDA concentration) (see 7.2.2). If the samples were
previously diluted, then the obtained concentration of MDA should be multiplied by the dilution factor.
Express the final value of MDA concentration per mg of leaf fresh weight.
7.2.2 MDA standard curve
‒1
To create the MDA standard curve, prepare several dilutions of the TMP working solution (10 µg ml ; 5.1.4)
with water. Table 1 presents the volume of TMP working solution and water (5.1.3) that can be used to obtain
---------
...
ISO/TC 190/SC 4
Secretariat: AFNOR
Date: 2026-04-1609-01
Soil quality — Responses of higher plants to environmental
stresses —
Part 1:
Methods to assess physiological parameters
All rights reserved. Unless otherwise specified, or required in the context of its implementation, no part of this publication
may be reproduced or utilized otherwise in any form or by any means, electronic or mechanical, including photocopying,
or posting on the internet or an intranet, without prior written permission. Permission can be requested from either ISO
at the address below or ISO’s member body in the country of the requester.
ISO copyright office
CP 401 • Ch. de Blandonnet 8
CH-1214 Vernier, Geneva
Phone: + 41 22 749 01 11
E-mail: copyright@iso.org
Website: www.iso.org
Published in Switzerland
ii
Contents
Foreword . iv
Introduction . v
1 Scope . 1
2 Normative references . 1
3 Terms and definitions . 1
4 Principle . 2
5 Reagents and material . 2
5.1 Chemicals and solutions . 2
5.2 Equipment . 3
5.3 Other materials . 3
6 Plants and sampling procedures . 4
7 Methods for physiological stress assessment . 5
7.1 General . 5
7.2 Malondialdehyde (MDA) content measurement . 5
7.3 Electrolyte leakage measurement . 6
7.4 Relative water content measurement . 7
7.5 Proline content measurement . 7
8 Data analysis and interpretation . 9
9 Test report . 11
Annex A (informative) Summary of the methods . 12
Bibliography . 16
iii
Foreword
ISO (the International Organization for Standardization) is a worldwide federation of national standards
bodies (ISO member bodies). The work of preparing International Standards is normally carried out through
ISO technical committees. Each member body interested in a subject for which a technical committee has been
established has the right to be represented on that committee. International organizations, governmental and
non-governmental, in liaison with ISO, also take part in the work. ISO collaborates closely with the
International Electrotechnical Commission (IEC) on all matters of electrotechnical standardization.
The procedures used to develop this document and those intended for its further maintenance are described
in the ISO/IEC Directives, Part 1. In particular, the different approval criteria needed for the different types of
ISO documents should be noted. This document was drafted in accordance with the editorial rules of the
ISO/IEC Directives, Part 2 (see www.iso.org/directives).
ISO draws attention to the possibility that the implementation of this document may involve the use of (a)
patent(s). ISO takes no position concerning the evidence, validity or applicability of any claimed patent rights
in respect thereof. As of the date of publication of this document, ISO had not received notice of (a) patent(s)
which may be required to implement this document. However, implementers are cautioned that this may not
represent the latest information, which may be obtained from the patent database available at
www.iso.org/patents. ISO shall not be held responsible for identifying any or all such patent rights.
Any trade name used in this document is information given for the convenience of users and does not
constitute an endorsement.
For an explanation of the voluntary nature of standards, the meaning of ISO specific terms and expressions
related to conformity assessment, as well as information about ISO’s adherence to the World Trade
Organization (WTO) principles in the Technical Barriers to Trade (TBT), see www.iso.org/iso/foreword.html.
This document was prepared by Technical Committee ISO/TC 190, Soil quality, Subcommittee SC 4, Biological
characterization.
A list of all parts in the ISO/TS 25008 series can be found on the ISO website.
Any feedback or questions on this document should be directed to the user’s national standards body. A
complete listing of these bodies can be found at www.iso.org/members.html.
iv
Introduction
Higher plants are important organisms in terrestrial ecosystems and are often exposed to different types of
environmental stressors. These stressors can induce genetic, metabolic and physiological perturbations in
plants. Within ISO/TC 190/SC 4, there are currently a few standardized methods available to assess these
perturbations, mainly based on developmental traits: germination (ISO 18763); emergence of seedlings
(ISO 17126); plant growth (ISO 11269-1 and ISO 11269-2, root growth and early growth, respectively); and
chronic toxicity (ISO 22030). Only two standards address specific parameters, i.e. genotoxicity (ISO 29200) or
biochemical parameters for leaf fatty acid composition (ISO 21479).
In addition to the parameters considered in these standards, the homeostasis of physiological processes and
oxidative biochemical responses in plants can also become impaired when exposed to stressful environmental
conditions. As a result, the resilience and plasticity of plants can be deeply constrained, thereby affecting their
capacity to adapt, survive and thrive in terrestrial ecosystems.
The ISO/TS 25008 series includes two parts describing a set of physiological (ISO/TS 25008-1) and
biochemical (ISO/TS 25008-2) parameters (Figure 1), of which the combined analysis can foster a more
holistic and comprehensive evaluation of the performance of plants exposed to soil pollutants or other
environmental stresses, comparatively to the analysis of isolated parameters.
Figure 1 — Schematic representation of the parameters covered
by the ISO/TS 25008 series
This document details methods for assessing relevant physiological processes in plants, namely associated
with oxidative damage (malondialdehyde content), cell membrane stability or permeability (electrolyte
leakage), plant water relations (relative water content), and metabolic changes (proline content) (Figure 1).
Lipid peroxidation is a process occurring through several reactions in which reactive oxygen species (ROS)
attack unsaturated lipids, causing oxidative injury to plants’ cell membranes and the accumulation of several
[18]
by-products, such as malondialdehyde (MDA) . MDA content has often been reported to increase in
v
[19] [20] [21] [22]
consequence of metal contamination , as well as in the presence of other stress-inducing agents ,
hence constituting a good indicator of oxidative stress in plants.
The measurement of electrolyte leakage has been also used as an indicator of the structural integrity and
permeability of cell membranes, which can be disrupted by ROS produced under exposure to stress agents,
[19] [23] [24] [25] [22]
such as metals , organic contaminants , heat stress and water deficit conditions .
Leaf relative water content (C ) is regularly determined for characterizing plant-water relations, being a
RW
suitable indicator of changes in the water pool of plants that can compromise cellular metabolism. The levels
of C can vary between species and genotypes, and can increase with the accumulation of osmolytes such as
RW
[26] [22] [27] [26]
proline. Leaf C is normally reduced under drought , heat , and salt stresses , but tends to increase
RW
[19] [28]
under metal contamination since metals can influence the water use efficiency by plants .
Plants can produce molecules capable of reducing the impact of unfavourable conditions. The aminoacid
proline is an osmolyte molecule frequently accumulated in higher amounts to enhance plants’ tolerance to
[19] [29]
different stress factors such as metals and other pollutants, salinity and heat stress. Moreover, the role
of proline is multifunctional, as it can scavenge ROS and interfere in cellular oxidative responses, stabilize cell
[30]
structures and mediate metabolic pathways activated for compensating the impacts of abiotic stresses.
Therefore, the analysis of proline content can provide a relevant overview of plant health status, especially if
complemented with the analysis of other biological responses.
Overall, changes (mostly an increase) in MDA content and electrolyte leakage can broadly better contribute
towards the assessment of soil contamination; whereas C and proline levels can often be more responsive
RW
to abiotic stressors in general. Notwithstanding, such a profile can vary according to the plant species and
their tolerance ranges. Therefore, the complementary analyses of these four physiological parameters in
conjunction is highly recommended, as it can provide an improved overview of plant responses to pollutants
and other common environmental changes, often co-occurring in the terrestrial compartment.
vi
Soil quality — Responses of higher plants to environmental stresses —
Part 1:
PhysiologicalMethods to assess physiological parameters
1 Scope
This document describes a set of physiological parameters allowing the measurement of sublethal effects in
higher plants exposed to soil pollutants and other stressors (e.g. drought, nutrient availability, heat stress). It
is applicable to soils of unknown quality (e.g. from contaminated sites, amended soils or soils after
remediation), either in situ or following laboratory exposure assays. This document specifies the methods for
analysing variations in physiological responses and oxidative damage that can be indicative of stress
symptoms in the leaves of higher plants, either monocotyledonous or dicotyledonous species.
2 Normative references
There are no normative references in this document.
The following documents are referred to in the text in such a way that some or all of their content constitutes
requirements of this document. For dated references, only the edition cited applies. For undated references,
the latest edition of the referenced document (including any amendments) applies.
ISO 11074, Soil quality — Vocabulary
3 Terms and definitions
For the purposes of this document, the terms and definitions given in ISO 11074 and the following apply.
ISO and IEC maintain terminology databases for use in standardization at the following addresses:
— ISO Online browsing platform: available at https://www.iso.org/obp
— IEC Electropedia: available at https://www.electropedia.org/
3.1
blank control
technical treatment (3.4) for evaluating the performance of the procedure and quality of the reagents
3.2
negative control condition
treatment (3.4) consisting of the optimum condition for the physiological performance of the plant
EXAMPLE Sample of a reference soil or a control soil with a mixture of known solutions, to which plants are exposed.
3.3
stress condition
treatment (3.4) consisting of the environmental stress condition under study
Note 1 to entry: Sample of a diluted and/or undiluted soil subjected to an environmental stress (e.g. contamination,
pollution, drought).
3.4
treatment
condition considered in the test, experiment or study (i.e. negative control, stress condition(s))
3.5
reading blank
measurement done to set the spectrophotometer to zero optical density
4 Principle
This document specifies four methods to determine changes on lipid peroxidation [malondialdehyde (MDA)
content], cell membrane integrity (electrolyte leakage, L ), hydric relations (relative water content, C ), and
E RW
metabolic variations (proline content) in leaf extracts. MDA and proline contents are determined through
spectrophotometric methods, whilst L and C are based, respectively, on conductivity and weight changes
E RW
after a period of incubation under specific conditions. It is highly recommended to conduct the four methods
in conjunction to evaluate changes in the physiological status of plants that can be indicative of stress
symptoms, within different locations or exposure times along a growth period of the plants in the soils under
assessment. These methods are applicable in different experimental frameworks, either in site-specific
monitoring programs, in in situ or laboratory exposure assays. For in situ experiments the areas to compare
shall be exposed to the same climatic conditions (humidity, temperature, sunlight).
5 Reagents and material
5.1 Chemicals and solutions
5.1.1 Trichloroacetic acid (TCA) 0,1 % and 20 % (w/v).
®1)
For preparing 0,1 % (w/v) TCA (CAS Registry Number 76-03-9) dissolve 0,5 g of the reagent in 400 ml of
water, mix to solubilize, and make up the volume to 500 ml in a volumetric flask. Store the solution at (4 ± 1) °C
protected from light. Remove the solution from the cooler approximately 30 minutes before use to warm up
to room temperature.
5.1.2 Solution of TCA 20 % / Thiobarbituric acid (TBA) 0,5 % (w/v).
Dissolve 100 g of TCA in 250 ml of water by heating at (40 ± 2) °C covered with aluminium foil until complete
solubilization of the reagent. Cool down the solution to room temperature.
‒1
Dissolve 2,5 g of TBA (CAS: 504-17-6) in approximately 5-10 ml of sodium hydroxide 0,1 mol l (CAS 1310-
73-2). Add approximately 50 ml of water, mix, and add to the 20 % TCA solution initially prepared. Heat the
mixture at (40 ± 2) °C in the dark until complete dissolution. Cool down the solution and then make up the
volume to 500 ml. Store the TBA-TCA solution at (4 ± 1) °C up to 1 week in the dark or freeze at (‒20 ± 1) °C
for longer periods of storage.
5.1.3 Water.
Sterilized [at (121 ± 1) °C and 15 psi for 20 minutes] or non-sterilized, as specified in the respective methods,
‒1
with a conductivity of (0,06 ± 0,02) µS cm (i.e. ultrapure water; recommended for electrolyte leakage)
‒1
or < 5 µS cm (i.e. distilled water; can be applied in the other methods).
5.1.4 MDA standard (1,1,3,3-Tetramethoxypropane, TMP).
1)
Chemical Abstracts Service (CAS) Registry Number® is a trademark of the American Chemical Society (ACS). This
information is given for the convenience of users of this document and does not constitute an endorsement by ISO of the
product named. Equivalent products may be used if they can be shown to lead to the same results.
MDA is not a stable molecule, but TMP (CAS 102-52-3) can be converted into MDA by acidic hydrolysis,
‒1 ‒1
thereby being used as an MDA standard. Prepare a standard stock solution of 1 mg ml (or 6,09 µmol ml ) by
‒1
adding 10 µl of TMP to 10 ml of 0,1 mol l HCl. The stock solution can be stored at (4 ± 1) °C protected from
‒1 ‒1
light up to one week. A working solution of 10 µg ml (or 60,9 nmol ml ) should be freshly prepared before
doing the standard curve by diluting 100 µl of the stock solution in 9,90 ml of water.
5.1.5 Sulfosalicylic acid 3 % (m/v).
Dissolve 3 g of 5-sulfosalicylic acid (CAS 5965-83-3; 2-hydroxy-5-sulfobenzoic acid) in 80 ml of water and
make up the volume to 100 ml. Store the solution at room temperature for weeks.
5.1.6 Glacial acetic acid (CAS 64-19-7).
5.1.7 Ninhydrin acid solution.
‒1
Add 1,25 g ninhydrin (CAS 485-47-2) in 30 ml glacial acetic acid (5.1.6) and 20 ml of 6 mol l phosphoric acid
(CAS 7664-38-2), and stir by warming up the solution (approximately 50 °C to 60 °C) until dissolved. Store the
solution at (4 ± 1) °C in the dark for up to 1 week.
5.1.8 Toluene (CAS 108-88-3).
Use the reagent as is.
5.1.9 L-proline standard solutions.
‒1
Prepare a 1 mg ml standard stock solution by dissolving 50 mg of L-proline (CAS 147-85-3) in 50 ml of
water. Make aliquots of 2 ml and store at (–20 ± 1) °C protected from light up to one month. Freshly prepare
‒1 ‒1
a 200 µg ml working solution of L-proline standard, by diluting 1 ml of the 1 mg ml stock solution in 4 ml
of water. Protect the working solution from light and keep it at (4 ± 1) °C until use.
5.2 Equipment
5.2.1 Analytical scale with readability of 0,001 g.
5.2.2 Centrifuge adaptable for microcentrifuge tubes, falcon and/or glass tubes.
5.2.3 Thermostatic water bath.
5.2.4 Spectrophotometer UV-Vis for reading absorbances at 520 nm, 532 nm, and 600 nm.
5.2.5 Orbital shaker.
5.2.6 Conductivity meter.
5.2.7 Autoclave.
5.2.8 Incubator or oven, working up to (70 ± 2) °C.
5.2.9 Vortex.
5.3 Other materials
5.3.1 Mortar and pestle made of porcelain.
5.3.2 Plastic falcon tubes of 14 ml to 15 ml.
5.3.3 Micropipette of 5 000 µl, 1 000 µl, 200 µl, 20 µl and 10 µl, and their respective tips.
5.3.4 Glass test tubes with lid of 10 ml to 14 ml resistant to centrifugation and (100 ± 1) °C incubations.
5.3.5 Glass or quartz cuvettes of 1 ml or 3 ml.
5.3.6 Glass vials with lid of 40 ml (approximately 3 cm diameter × 8 cm height) resistant to autoclaving.
5.3.7 Sterile absorbent paper [sterilization at (121 ± 1) °C and 15 psi for 20 minutes].
5.3.8 Plastic petri dishes with 90 mm of diameter.
5.3.9 Plastic microtubes (i.e. microcentrifuge tubes) of 1,5 ml and 2 ml.
6 Plants and sampling procedures
The described methods can be applied to higher plants, either monocotyledonous or dicotyledonous, for
example crop plants (e.g. corn, tomato, lettuce) and trees (pine, willow, ash, olive).
The methods can be used to assess the plant physiological status either along several sampling time intervals
or at the end of a growth period, or both, under soils which quality is being assessed. The frequency of
sampling depends on the goal, type and experimental set-up (i.e. monitoring program, in situ or laboratory
assay) of the study, as well as the exposure period performed. Seedlings and adult plants resulting from the
performance of different ISO standard tests (e.g. seedling emergence test, chronic toxicity test) can be used,
as far as appropriate controls and control conditions are established during the experiments, for comparison
means.
For assays conducted under controlled conditions (i.e. laboratory and greenhouse experiments), at least five
leaves (or a piece of leaf), one per plant replicate, should be harvested per treatment (e.g. control soil, soil
sample or dilution), parameter or method, and sampling time (if applicable). The amount of leaf tissue per
plant replicate necessary to conduct the 4 measurements or methods can range between 2 g and 3 g,
depending on the type or size of the leaf and on its fresh biomass. Considering that the analytical methods are
invasive, additional plant replicates can be implemented per treatment if several sampling times are
conducted.
For on-site monitoring studies aiming to obtain an overview of the phytocenosis, the larger the number of
species sampled, the more representative the results are of the “soil quality” for the overall phytocenosis.
Hence, in this case, the various areas of the site are firstly prospected, and several species of plants to sample
are chosen among the most representative and, to the extent possible, the more common to all areas.
Nevertheless, for the assessment of agricultural practices, for site-specific risk assessment studies, or for in
situ assays, only one plant species can be of interest and sampled, namely the cultivated crop or the selected
test plant. For risk assessment and in situ assays, a reference versus a contaminated, remediated or
stress-impacted area or soil should be sampled or tested. Irrespective of the on-site study approach, one leaf
(or a piece of leaf) of at least 5 individuals per species is collected per area, by doing the following:
— do not consider leaves under hydric (drought) or biotic (pathogens) stress, only green leaves shall be
harvested;
— harvest leaves on plants of similar size, consequently, harvesting leaves from small plants on one area and
leaves from tall plants on another shall not be undertaken;
— as a precautionary measure, harvest only mature leaves and disregard developing ones;
— when only a part of leaves is sampled from a given species, harvest the same part of the leaves (for example
the distal part) for all individuals;
— as a precautionary measure, harvest all the plants within 2 to 3 hours.
For all experimental approaches, the harvested leaves should be analysed immediately, particularly for MDA
content, L and C . For the analysis of proline content, either use the freshly harvested leaves or, if not
E RW
possible, snap freeze them in liquid nitrogen, and store at (–80 ± 1) °C until initiating the analysis procedure.
7 Methods for physiological stress assessment
7.1 General
The methods detailed in 7.2 to 7.5 are summarized in the Tables A.1 to A.4 and in Figures A.1 to Figure A.4
in Annex A.
7.2 Malondialdehyde (MDA) content measurement
7.2.1 Procedure to determine MDA levels
MDA is a product of lipid peroxidation, which results from the degradation of cell membrane integrity.
Thereby, the MDA content in monocotyledonous or dicotyledonous plant leaves is indicative of the lipid
31 32
peroxidation level . The principle of the assay relies on the reaction of one molecule of MDA with
2 molecules of TBA under high temperature, forming the MDA-2TBA adduct of pink colour that is detectable
at 532 nm.
Besides the testing of leaf samples from the different experimental treatments (e.g. negative control and stress
condition) it is recommended to include a blank control of the procedure, in which the leaf extract is replaced
by water (5.1.3).
Homogenize (350 ± 100) mg (use an analytical scale, 5.2.1) of a fresh leaf per plant replicate (from at least 5
plant replicates) in 5 ml of 0,1 % TCA (5.1.1), using a mortar and a pestle (5.3.1). Transfer the homogenate of
leaf extract to a falcon tube (5.3.2) and centrifuge (5.2.2) at 10 000g and (4 ± 1) °C for 10 minutes. Pipette
(5.3.3) 1 ml of the supernatant (or 1 ml of water for the blank control) to a glass test tube with lid (5.3.4) and
add 4 ml of TCA/TBA solution (20 %/0,5 %; 5.1.2). Incubate the mixture at (95 ± 1) °C for 30 minutes in a
water bath (5.2.3) to form the MDA-TBA adduct, and immediately after, cool it down in iced-cold water.
Centrifuge the tubes at 10 000g and (4 ± 1) °C for 10 minutes. The absorbance of the supernatant is
spectrophotometrically measured at 532 nm and 600 nm (5.2.4) in glass or quartz cuvettes (5.3.5).
The MDA equivalent is computed by subtracting the absorbance reading at 600 nm (A ; removing the
influence of turbidity) to that measured at 532 nm (A ), and using a molar extinction coefficient
−1 −1 31
of ε = 0,155 M cm . The following Formula (1)Formula (1) can be applied:
E = ((A – A ) / 0,155 × Ll) × F / W (1)
MDA 532 600 D LF
where
‒1
E is equivalents of MDA, expressed in µmol mg ;
MDA
A is absorbance measured at 532 nm or 600 nm;
Ll is the cuvette width (1 cm);
F is the sample dilution factor (1 if sample is not diluted);
D
W corresponds to the leaf fresh weight (in mg) used for preparing the homogenates.
LF
Alternatively, the MDA concentration can be determined from the standard curve, by replacing the y
(corrected A ) in the equation to derive the x value (MDA concentration) (see 7.2.2). If the samples were
previously diluted, then the obtained concentration of MDA should be multiplied by the dilution factor.
Express the final value of MDA concentration per mg of leaf fresh weight.
7.2.2 MDA standard curve
‒1
To create the MDA standard curve, prepare several dilutions of the TMP working solution (10 µg ml ; 5.1.4)
with water. Table 1 presents the volume of TMP working solution and water (5.1.3) that can be used to obtain
a range of standard concentrations, which can be adjusted according to the MDA values in the samples under
analysis.
Table 1 — Preparation of TMP standard concentrations for generating the MDA standard curve
V per V per
TWS dH2O
Concentration of TPM
replicate replicate
‒1 ‒1
(µg ml ) (µmol ml ) (µM) (ml) (ml)
0 0 0 0 1
0,031 0,000 2 0,2 0,003 0,997
0,063 0,000 4 0,4 0,006 0,994
0,13 0,000 8 0,8 0,013 0,988
0,25 0,001 5 1,5 0,025 0,975
0,50 0,003 3,0 0,050 0,950
1 0,006 6,1 0,100 0,900
2 0,012 12,2 0,200 0,800
4 0,024 24,4 0,400 0,600
Total volume for 3 replicates (ml) 2,39 24,61
VTWS volume of TPM working solution
V volume of distilled water
dH2O
Pipette 1 ml of TMP working solution to the respective test tube (5.3.4), in triplicate (i.e. 3 replicate tubes per
sample). Add into each test tube 4 ml of TCA/TBA solution (5.1.2) and incubate at (95 ± 1) °C for 30 minutes.
Afterwards, cool it down in an iced-cold water bath. Centrifuge (5.2.2) the tubes at 10 000g and (4 ± 1) °C
for 10 minutes. Read the absorbance at 532 nm and 600 nm, against a blank control (i.e. concentration of 0 µg
‒1
ml ; Table 1).
Subtract the absorbance reading at 600 nm from that at 532 nm. Calculate the average ± standard deviation
of the corrected absorbance at 532 nm, and plot the obtained value for each standard (yy’ axis) against the
concentration of MDA standard (xx’ axis). Adjust a linear model to the data points and generate the equation
of the standard curve (i.e. y(x) = ax + b).
7.3 Electrolyte leakage measurement
Electrolyte leakage provides an indication o
...
FINAL DRAFT
Technical
Specification
ISO/DTS 25008-1
ISO/TC 190/SC 4
Soil quality — Responses of higher
Secretariat: AFNOR
plants to environmental stresses —
Voting begins on:
2026-05-01
Part 1:
Physiological parameters
Voting terminates on:
2026-06-26
RECIPIENTS OF THIS DRAFT ARE INVITED TO SUBMIT,
WITH THEIR COMMENTS, NOTIFICATION OF ANY
RELEVANT PATENT RIGHTS OF WHICH THEY ARE AWARE
AND TO PROVIDE SUPPOR TING DOCUMENTATION.
IN ADDITION TO THEIR EVALUATION AS
BEING ACCEPTABLE FOR INDUSTRIAL, TECHNO-
LOGICAL, COMMERCIAL AND USER PURPOSES, DRAFT
INTERNATIONAL STANDARDS MAY ON OCCASION HAVE
TO BE CONSIDERED IN THE LIGHT OF THEIR POTENTIAL
TO BECOME STAN DARDS TO WHICH REFERENCE MAY BE
MADE IN NATIONAL REGULATIONS.
Reference number
ISO/DTS 25008-1:2026(en) © ISO 2026
FINAL DRAFT
ISO/DTS 25008-1:2026(en)
Technical
Specification
ISO/DTS 25008-1
ISO/TC 190/SC 4
Soil quality — Responses of higher
Secretariat: AFNOR
plants to environmental stresses —
Voting begins on:
Part 1:
Physiological parameters
Voting terminates on:
RECIPIENTS OF THIS DRAFT ARE INVITED TO SUBMIT,
WITH THEIR COMMENTS, NOTIFICATION OF ANY
RELEVANT PATENT RIGHTS OF WHICH THEY ARE AWARE
AND TO PROVIDE SUPPOR TING DOCUMENTATION.
© ISO 2026
IN ADDITION TO THEIR EVALUATION AS
All rights reserved. Unless otherwise specified, or required in the context of its implementation, no part of this publication may
BEING ACCEPTABLE FOR INDUSTRIAL, TECHNO-
LOGICAL, COMMERCIAL AND USER PURPOSES, DRAFT
be reproduced or utilized otherwise in any form or by any means, electronic or mechanical, including photocopying, or posting on
INTERNATIONAL STANDARDS MAY ON OCCASION HAVE
the internet or an intranet, without prior written permission. Permission can be requested from either ISO at the address below
TO BE CONSIDERED IN THE LIGHT OF THEIR POTENTIAL
or ISO’s member body in the country of the requester.
TO BECOME STAN DARDS TO WHICH REFERENCE MAY BE
MADE IN NATIONAL REGULATIONS.
ISO copyright office
CP 401 • Ch. de Blandonnet 8
CH-1214 Vernier, Geneva
Phone: +41 22 749 01 11
Email: copyright@iso.org
Website: www.iso.org
Published in Switzerland Reference number
ISO/DTS 25008-1:2026(en) © ISO 2026
ii
ISO/DTS 25008-1:2026(en)
Contents Page
Foreword .iv
Introduction .v
1 Scope . 1
2 Normative references . 1
3 Terms and definitions . 1
4 Principle . 2
5 Reagents and material . 2
5.1 Chemicals and solutions .2
5.2 Equipment .3
5.3 Other materials .3
6 Plants and sampling procedures . 4
7 Methods for physiological stress assessment . 5
7.1 General .5
7.2 MDA content measurement .5
7.2.1 Procedure to determine MDA levels .5
7.2.2 MDA standard curve .5
7.3 Electrolyte leakage measurement .6
7.4 C measurement .6
RW
7.5 Proline content measurement.7
7.5.1 Procedure to determine proline levels .7
7.5.2 Proline standard curve .7
8 Data analysis and interpretation . 8
9 Test report .11
Annex A (informative) Summary of the methods .12
Bibliography .16
iii
ISO/DTS 25008-1:2026(en)
Foreword
ISO (the International Organization for Standardization) is a worldwide federation of national standards
bodies (ISO member bodies). The work of preparing International Standards is normally carried out through
ISO technical committees. Each member body interested in a subject for which a technical committee
has been established has the right to be represented on that committee. International organizations,
governmental and non-governmental, in liaison with ISO, also take part in the work. ISO collaborates closely
with the International Electrotechnical Commission (IEC) on all matters of electrotechnical standardization.
The procedures used to develop this document and those intended for its further maintenance are described
in the ISO/IEC Directives, Part 1. In particular, the different approval criteria needed for the different types
of ISO documents should be noted. This document was drafted in accordance with the editorial rules of the
ISO/IEC Directives, Part 2 (see www.iso.org/directives).
ISO draws attention to the possibility that the implementation of this document may involve the use of (a)
patent(s). ISO takes no position concerning the evidence, validity or applicability of any claimed patent
rights in respect thereof. As of the date of publication of this document, ISO had not received notice of (a)
patent(s) which may be required to implement this document. However, implementers are cautioned that
this may not represent the latest information, which may be obtained from the patent database available at
www.iso.org/patents. ISO shall not be held responsible for identifying any or all such patent rights.
Any trade name used in this document is information given for the convenience of users and does not
constitute an endorsement.
For an explanation of the voluntary nature of standards, the meaning of ISO specific terms and expressions
related to conformity assessment, as well as information about ISO’s adherence to the World Trade
Organization (WTO) principles in the Technical Barriers to Trade (TBT), see www.iso.org/iso/foreword.html.
This document was prepared by Technical Committee ISO/TC 190, Soil quality, Subcommittee SC 4, Biological
characterization.
A list of all parts in the ISO/TS 25008 series can be found on the ISO website.
Any feedback or questions on this document should be directed to the user’s national standards body. A
complete listing of these bodies can be found at www.iso.org/members.html.
iv
ISO/DTS 25008-1:2026(en)
Introduction
Higher plants are important organisms in terrestrial ecosystems and are often exposed to different types
of environmental stressors. These stressors can induce genetic, metabolic and physiological perturbations
in plants. Within ISO/TC 190/SC 4, there are currently a few standardized methods available to assess these
perturbations, mainly based on developmental traits: germination (ISO 18763); emergence of seedlings
(ISO 17126); plant growth (ISO 11269-1 and ISO 11269-2, root growth and early growth, respectively); and
chronic toxicity (ISO 22030). Only two standards address specific parameters, i.e. genotoxicity (ISO 29200)
or biochemical parameters for leaf fatty acid composition (ISO 21479).
In addition to the parameters considered in these standards, the homeostasis of physiological processes
and oxidative biochemical responses in plants can also become impaired when exposed to stressful
environmental conditions. As a result, the resilience and plasticity of plants can be deeply constrained,
thereby affecting their capacity to adapt, survive and thrive in terrestrial ecosystems.
The ISO/TS 25008 series includes two parts describing a set of physiological (ISO/TS 25008-1) and
biochemical (ISO/TS 25008-2) parameters (Figure 1), of which the combined analysis can foster a more
holistic and comprehensive evaluation of the performance of plants exposed to soil pollutants or other
environmental stresses, comparatively to the analysis of isolated parameters.
Figure 1 — Schematic representation of the parameters covered
by the ISO/TS 25008 series
This document details methods for assessing relevant physiological processes in plants, namely associated
with oxidative damage (malondialdehyde content), cell membrane stability or permeability (electrolyte
leakage), plant water relations (relative water content), and metabolic changes (proline content) (Figure 1).
Lipid peroxidation is a process occurring through several reactions in which reactive oxygen species (ROS)
attack unsaturated lipids, causing oxidative injury to plants’ cell membranes and the accumulation of
[18]
several by-products, such as malondialdehyde (MDA) . MDA content has often been reported to increase in
[19][20][21] [22]
consequence of metal contamination , as well as in the presence of other stress-inducing agents ,
hence constituting a good indicator of oxidative stress in plants.
v
ISO/DTS 25008-1:2026(en)
The measurement of electrolyte leakage has been also used as an indicator of the structural integrity and
permeability of cell membranes, which can be disrupted by ROS produced under exposure to stress agents,
[19][23] [24] [25] [22]
such as metals , organic contaminants , heat stress and water deficit conditions .
Leaf relative water content (C ) is regularly determined for characterizing plant-water relations, being a
RW
suitable indicator of changes in the water pool of plants that can compromise cellular metabolism. The levels
of C can vary between species and genotypes, and can increase with the accumulation of osmolytes such
RW
[26] [22] [27] [26]
as proline. Leaf C is normally reduced under drought , heat , and salt stresses , but tends to
RW
[19] [28]
increase under metal contamination since metals can influence the water use efficiency by plants .
Plants can produce molecules capable of reducing the impact of unfavourable conditions. The aminoacid
proline is an osmolyte molecule frequently accumulated in higher amounts to enhance plants’ tolerance
[19] [29]
to different stress factors such as metals and other pollutants, salinity and heat stress. Moreover,
the role of proline is multifunctional, as it can scavenge ROS and interfere in cellular oxidative responses,
stabilize cell structures and mediate metabolic pathways activated for compensating the impacts of abiotic
[30]
stresses. Therefore, the analysis of proline content can provide a relevant overview of plant health status,
especially if complemented with the analysis of other biological responses.
Overall, changes (mostly an increase) in MDA content and electrolyte leakage can broadly better contribute
towards the assessment of soil contamination; whereas C and proline levels can often be more responsive
RW
to abiotic stressors in general. Notwithstanding, such a profile can vary according to the plant species and
their tolerance ranges. Therefore, the complementary analyses of these four physiological parameters in
conjunction is highly recommended, as it can provide an improved overview of plant responses to pollutants
and other common environmental changes, often co-occurring in the terrestrial compartment.
vi
FINAL DRAFT Technical Specification ISO/DTS 25008-1:2026(en)
Soil quality — Responses of higher plants to environmental
stresses —
Part 1:
Physiological parameters
1 Scope
This document describes a set of physiological parameters allowing the measurement of sublethal effects
in higher plants exposed to soil pollutants and other stressors (e.g. drought, nutrient availability, heat
stress). It is applicable to soils of unknown quality (e.g. from contaminated sites, amended soils or soils after
remediation), either in situ or following laboratory exposure assays. This document specifies the methods
for analysing variations in physiological responses and oxidative damage that can be indicative of stress
symptoms in the leaves of higher plants, either monocotyledonous or dicotyledonous species.
2 Normative references
There are no normative references in this document.
3 Terms and definitions
For the purposes of this document, the following terms and definitions apply.
ISO and IEC maintain terminology databases for use in standardization at the following addresses:
— ISO Online browsing platform: available at https:// www .iso .org/ obp
— IEC Electropedia: available at https:// www .electropedia .org/
3.1
blank control
technical treatment (3.4) for evaluating the performance of the procedure and quality of the reagents
3.2
negative control condition
treatment (3.4) consisting of the optimum condition for the physiological performance of the plant
EXAMPLE Sample of a reference soil or a control soil with a mixture of known solutions, to which plants are
exposed.
3.3
stress condition
treatment (3.4) consisting of the environmental stress condition under study
Note 1 to entry: Sample of a diluted and/or undiluted soil subjected to an environmental stress (e.g. contamination,
pollution, drought).
3.4
treatment
condition considered in the test, experiment or study (i.e. negative control, stress condition(s))
ISO/DTS 25008-1:2026(en)
3.5
reading blank
measurement done to set the spectrophotometer to zero optical density
4 Principle
This document specifies four methods to determine changes on lipid peroxidation [malondialdehyde (MDA)
content], cell membrane integrity (electrolyte leakage, E ), hydric relations (relative water content, C ),
L RW
and metabolic variations (proline content) in leaf extracts. MDA and proline contents are determined
through spectrophotometric methods, whilst E and C are based, respectively, on conductivity and weight
L RW
changes after a period of incubation under specific conditions. It is highly recommended to conduct the four
methods in conjunction to evaluate changes in the physiological status of plants that can be indicative of
stress symptoms, within different locations or exposure times along a growth period of the plants in the
soils under assessment. These methods are applicable in different experimental frameworks, either in site-
specific monitoring programs, in in situ or laboratory exposure assays. For in situ experiments the areas to
compare shall be exposed to the same climatic conditions (humidity, temperature, sunlight).
5 Reagents and material
5.1 Chemicals and solutions
5.1.1 Trichloroacetic acid (TCA) 0,1 % and 20 % (w/v).
®1)
For preparing 0,1 % (w/v) TCA (CAS Registry Number 76-03-9) dissolve 0,5 g of the reagent in 400 ml
of water, mix to solubilize, and make up the volume to 500 ml in a volumetric flask. Store the solution at
(4 ± 1) °C protected from light. Remove the solution from the cooler approximately 30 minutes before use to
warm up to room temperature.
5.1.2 Solution of TCA 20 % / Thiobarbituric acid (TBA) 0,5 % (w/v).
Dissolve 100 g of TCA in 250 ml of water by heating at (40 ± 2) °C covered with aluminium foil until complete
solubilization of the reagent. Cool down the solution to room temperature.
‒1
Dissolve 2,5 g of TBA (CAS: 504-17-6) in approximately 5-10 ml of sodium hydroxide 0,1 mol l (CAS 1310-
73-2). Add approximately 50 ml of water, mix, and add to the 20 % TCA solution initially prepared. Heat the
mixture at (40 ± 2) °C in the dark until complete dissolution. Cool down the solution and then make up the
volume to 500 ml. Store the TBA-TCA solution at (4 ± 1) °C up to 1 week in the dark or freeze at (‒20 ± 1) °C
for longer periods of storage.
5.1.3 Water.
Sterilized [at (121 ± 1) °C and 15 psi for 20 minutes] or non-sterilized, as specified in the respective methods,
‒1
with a conductivity of (0,06 ± 0,02) µS cm (i.e. ultrapure water; recommended for electrolyte leakage)
‒1
or < 5 µS cm (i.e. distilled water; can be applied in the other methods).
5.1.4 MDA standard (1,1,3,3-Tetramethoxypropane, TMP).
MDA is not a stable molecule, but TMP (CAS 102-52-3) can be converted into MDA by acidic hydrolysis,
‒1 ‒1
thereby being used as an MDA standard. Prepare a standard stock solution of 1 mg ml (or 6,09 µmol ml )
‒1
by adding 10 µl of TMP to 10 ml of 0,1 mol l HCl. The stock solution can be stored at (4 ± 1) °C protected
‒1 ‒1
from light up to one week. A working solution of 10 µg ml (or 60,9 nmol ml ) should be freshly prepared
before doing the standard curve by diluting 100 µl of the stock solution in 9,90 ml of water.
1) Chemical Abstracts Service (CAS) Registry Number® is a trademark of the American Chemical Society (ACS). This
information is given for the convenience of users of this document and does not constitute an endorsement by ISO of the
product named. Equivalent products may be used if they can be shown to lead to the same results.
ISO/DTS 25008-1:2026(en)
5.1.5 Sulfosalicylic acid 3 % (m/v).
Dissolve 3 g of 5-sulfosalicylic acid (CAS 5965-83-3; 2-hydroxy-5-sulfobenzoic acid) in 80 ml of water and
make up the volume to 100 ml. Store the solution at room temperature for weeks.
5.1.6 Glacial acetic acid (CAS 64-19-7).
5.1.7 Ninhydrin acid solution.
‒1
Add 1,25 g ninhydrin (CAS 485-47-2) in 30 ml glacial acetic acid (5.1.6) and 20 ml of 6 mol l phosphoric acid
(CAS 7664-38-2), and stir by warming up the solution (approximately 50 °C to 60 °C) until dissolved. Store
the solution at (4 ± 1) °C in the dark for up to 1 week.
5.1.8 Toluene (CAS 108-88-3).
Use the reagent as is.
5.1.9 L-proline standard solutions.
‒1
Prepare a 1 mg ml standard stock solution by dissolving 50 mg of L-proline (CAS 147-85-3) in 50 ml of
water. Make aliquots of 2 ml and store at (–20 ± 1) °C protected from light up to one month. Freshly prepare
‒1 ‒1
a 200 µg ml working solution of L-proline standard, by diluting 1 ml of the 1 mg ml stock solution in 4 ml
of water. Protect the working solution from light and keep it at (4 ± 1) °C until use.
5.2 Equipment
5.2.1 Analytical scale with readability of 0,001 g.
5.2.2 Centrifuge adaptable for microcentrifuge tubes, falcon and/or glass tubes.
5.2.3 Thermostatic water bath.
5.2.4 Spectrophotometer UV-Vis for reading absorbances at 520 nm, 532 nm, and 600 nm.
5.2.5 Orbital shaker.
5.2.6 Conductivity meter.
5.2.7 Autoclave.
5.2.8 Incubator or oven, working up to (70 ± 2) °C.
5.2.9 Vortex.
5.3 Other materials
5.3.1 Mortar and pestle made of porcelain.
5.3.2 Plastic falcon tubes of 14 ml to 15 ml.
5.3.3 Micropipette of 5 000 µl, 1 000 µl, 200 µl, 20 µl and 10 µl, and their respective tips.
5.3.4 Glass test tubes with lid of 10 ml to 14 ml resistant to centrifugation and (100 ± 1) °C incubations.
ISO/DTS 25008-1:2026(en)
5.3.5 Glass or quartz cuvettes of 1 ml or 3 ml.
5.3.6 Glass vials with lid of 40 ml (approximately 3 cm diameter × 8 cm height) resistant to autoclaving.
5.3.7 Sterile absorbent paper [sterilization at (121 ± 1) °C and 15 psi for 20 minutes].
5.3.8 Plastic petri dishes with 90 mm of diameter.
5.3.9 Plastic microtubes (i.e. microcentrifuge tubes) of 1,5 ml and 2 ml.
6 Plants and sampling procedures
The described methods can be applied to higher plants, either monocotyledonous or dicotyledonous, for
example crop plants (e.g. corn, tomato, lettuce) and trees (pine, willow, ash, olive).
The methods can be used to assess the plant physiological status either along several sampling time intervals
or at the end of a growth period, or both, under soils which quality is being assessed. The frequency of
sampling depends on the goal, type and experimental set-up (i.e. monitoring program, in situ or laboratory
assay) of the study, as well as the exposure period performed. Seedlings and adult plants resulting from the
performance of different ISO standard tests (e.g. seedling emergence test, chronic toxicity test) can be used,
as far as appropriate controls and control conditions are established during the experiments, for comparison
means.
For assays conducted under controlled conditions (i.e. laboratory and greenhouse experiments), at least
five leaves (or a piece of leaf), one per plant replicate, should be harvested per treatment (e.g. control soil,
soil sample or dilution), parameter or method, and sampling time (if applicable). The amount of leaf tissue
per plant replicate necessary to conduct the 4 measurements or methods can range between 2 g and 3 g,
depending on the type or size of the leaf and on its fresh biomass. Considering that the analytical methods
are invasive, additional plant replicates can be implemented per treatment if several sampling times are
conducted.
For on-site monitoring studies aiming to obtain an overview of the phytocenosis, the larger the number of
species sampled, the more representative the results are of the “soil quality” for the overall phytocenosis.
Hence, in this case, the various areas of the site are firstly prospected, and several species of plants to
sample are chosen among the most representative and, to the extent possible, the more common to all
areas. Nevertheless, for the assessment of agricultural practices, for site-specific risk assessment studies,
or for in situ assays, only one plant species can be of interest and sampled, namely the cultivated crop or the
selected test plant. For risk assessment and in situ assays, a reference versus a contaminated, remediated or
stress-impacted area or soil should be sampled or tested. Irrespective of the on-site study approach, one leaf
(or a piece of leaf) of at least 5 individuals per species is collected per area, by doing the following:
— do not consider leaves under hydric (drought) or biotic (pathogens) stress, only green leaves shall be
harvested;
— harvest leaves on plants of similar size, consequently, harvesting leaves from small plants on one area
and leaves from tall plants on another shall not be undertaken;
— as a precautionary measure, harvest only mature leaves and disregard developing ones;
— when only a part of leaves is sampled from a given species, harvest the same part of the leaves (for
example the distal part) for all individuals;
— as a precautionary measure, harvest all the plants within 2 to 3 hours.
For all experimental approaches, the harvested leaves should be analysed immediately, particularly for MDA
content, EL and C . For the analysis of proline content, either use the freshly harvested leaves or, if not
RW
possible, snap freeze them in liquid nitrogen, and store at (–80 ± 1) °C until initiating the analysis procedure.
ISO/DTS 25008-1:2026(en)
7 Methods for physiological stress assessment
7.1 General
The methods detailed in 7.2 to 7.5 are summarized in the Tables A.1 to A.4 and in Figures A.1 to A.4
in Annex A.
7.2 MDA content measurement
7.2.1 Procedure to determine MDA levels
MDA is a product of lipid peroxidation, which results from the degradation of cell membrane integrity.
Thereby, the MDA content in monocotyledonous or dicotyledonous plant leaves is indicative of the lipid
[31][32]
peroxidation level . The principle of the assay relies on the reaction of one molecule of MDA with
2 molecules of TBA under high temperature, forming the MDA-2TBA adduct of pink colour that is detectable
at 532 nm.
Besides the testing of leaf samples from the different experimental treatments (e.g. negative control and
stress condition) it is recommended to include a blank control of the procedure, in which the leaf extract is
replaced by water (5.1.3).
Homogenize (350 ± 100) mg (use an analytical scale, 5.2.1) of a fresh leaf per plant replicate (from at least
5 plant replicates) in 5 ml of 0,1 % TCA (5.1.1), using a mortar and a pestle (5.3.1). Transfer the homogenate
of leaf extract to a falcon tube (5.3.2) and centrifuge (5.2.2) at 10 000g and (4 ± 1) °C for 10 minutes. Pipette
(5.3.3) 1 ml of the supernatant (or 1 ml of water for the blank control) to a glass test tube with lid (5.3.4)
and add 4 ml of TCA/TBA solution (20 %/0,5 %; 5.1.2). Incubate the mixture at (95 ± 1) °C for 30 minutes
in a water bath (5.2.3) to form the MDA-TBA adduct, and immediately after, cool it down in iced-cold
water. Centrifuge the tubes at 10 000g and (4 ± 1) °C for 10 minutes. The absorbance of the supernatant is
spectrophotometrically measured at 532 nm and 600 nm (5.2.4) in glass or quartz cuvettes (5.3.5).
The MDA equivalent is computed by subtracting the absorbance reading at 600 nm (A ; removing
the influence of turbidity) to that measured at 532 nm (A ), and using a molar extinction coefficient
−1 −1[31]
of ε = 0,155 M cm . The following Formula (1) can be applied:
E = ((A – A ) / 0,155 × L) × F / W (1)
MDA 532 600 D LF
where
‒1
E is equivalents of MDA, expressed in µmol mg ;
MDA
A is absorbance measured at 532 nm or 600 nm;
L is the cuvette width (1 cm);
F is the sample dilution factor (1 if sample is not diluted);
D
W corresponds to the leaf fresh weight (in mg) used for preparing the homogenates.
LF
Alternatively, the MDA concentration can be determined from the standard curve, by replacing the y
(corrected A ) in the equation to derive the x value (MDA concentration) (see 7.2.2). If the samples were
previously diluted, then the obtained concentration of MDA should be multiplied by the dilution factor.
Express the final value of MDA concentration per mg of leaf fresh weight.
7.2.2 MDA standard curve
‒1
To create the MDA standard curve, prepare several dilutions of the TMP working solution (10 µg ml ; 5.1.4)
with water. Table 1 presents the volume of TMP working solution and water (5.1.3) that can be used to obtain
a range of standard concentrations, which can be adjusted according to the MDA values in the samples under
analysis.
ISO/DTS 25008-1:2026(en)
Table 1 — Preparation of TMP standard concen
...
ISO/DTS 25008-1:2026(E)
ISO/TC 190/SC 4/WG 3
Secretariat: AFNOR
Date: 2026-02-1904-16
Soil quality — Responses of higher plants to environmental stresses
— —
Part 1:
Physiological parameters
ISO #####-#:####(X/DTS 25008-1:(en)
All rights reserved. Unless otherwise specified, or required in the context of its implementation, no part of this publication
may be reproduced or utilized otherwise in any form or by any means, electronic or mechanical, including photocopying,
or posting on the internet or an intranet, without prior written permission. Permission can be requested from either ISO
at the address below or ISO’s member body in the country of the requester.
ISO copyright office
CP 401 • Ch. de Blandonnet 8
CH-1214 Vernier, Geneva
Phone: + 41 22 749 01 11
EmailE-mail: copyright@iso.org
Website: www.iso.orgwww.iso.org
Published in Switzerland
© ISO #### 2026 – All rights reserved
ii
ISO/DTS 25008-1:2026(E:(en)
Contents Page
Foreword . iv
Introduction . v
1 Scope . 1
2 Normative references . 1
3 Terms and definitions . 1
4 Principle . 2
5 Reagents and material . 2
5.1 Chemicals and solutions . 2
5.2 Equipment . 3
5.3 Other materials . 3
6 Plants and sampling procedures . 4
7 Methods for physiological stress assessment . 5
7.1 General . 5
7.2 MDA content measurement . 5
7.3 Electrolyte leakage measurement . 7
7.4 C measurement . 7
RW
7.5 Proline content measurement . 7
8 Data analysis and interpretation . 9
9 Test report . 12
Annex A (informative) Summary of the methods . 13
Bibliography . 19
iii
ISO #####-#:####(X/DTS 25008-1:(en)
Foreword
ISO (the International Organization for Standardization) is a worldwide federation of national standards
bodies (ISO member bodies). The work of preparing International Standards is normally carried out through
ISO technical committees. Each member body interested in a subject for which a technical committee has been
established has the right to be represented on that committee. International organizations, governmental and
non-governmental, in liaison with ISO, also take part in the work. ISO collaborates closely with the
International Electrotechnical Commission (IEC) on all matters of electrotechnical standardization.
The procedures used to develop this document and those intended for its further maintenance are described
in the ISO/IEC Directives, Part 1. In particular, the different approval criteria needed for the different types of
ISO documents should be noted. This document was drafted in accordance with the editorial rules of the
ISO/IEC Directives, Part 2 (see www.iso.org/directives).
ISO draws attention to the possibility that the implementation of this document may involve the use of (a)
patent(s). ISO takes no position concerning the evidence, validity or applicability of any claimed patent rights
in respect thereof. As of the date of publication of this document, ISO [had/had not] received notice of (a)
patent(s) which may be required to implement this document. However, implementers are cautioned that this
may not represent the latest information, which may be obtained from the patent database available at
www.iso.org/patents. ISO shall not be held responsible for identifying any or all such patent rights.
Any trade name used in this document is information given for the convenience of users and does not
constitute an endorsement.
For an explanation of the voluntary nature of standards, the meaning of ISO specific terms and expressions
related to conformity assessment, as well as information about ISO'sISO’s adherence to the World Trade
Organization (WTO) principles in the Technical Barriers to Trade (TBT), see www.iso.org/iso/foreword.html.
This document was prepared by Technical Committee ISO/TC 190, Soil quality, Subcommittee SC 4, Biological
characterization.
A list of all parts in the ISO/TS 25008 series can be found on the ISO website.
Any feedback or questions on this document should be directed to the user’s national standards body. A
complete listing of these bodies can be found at www.iso.org/members.html.
© ISO #### 2026 – All rights reserved
iv
ISO/DTS 25008-1:2026(E:(en)
Introduction
Higher plants are important organisms in terrestrial ecosystems, and are often exposed to different types of
environmental stressors. These stressors can induce genetic, metabolic and physiological perturbations in
plants. Within ISO/TC 190/SC 4, there are currently a few standardized methods available to assess these
[1]
perturbations, mainly based on developmental traits: germination (ISO 18763) ;); emergence of seedlings
[2] [3] [4]
(ISO 17126) ;); plant growth (ISO 11269--1 and ISO 11269-2 ,, root growth and early growth,
[5]
respectively); and chronic toxicity (ISO 22030) .). Only two standards address specific parameters, i.e.,.
[6] [7]
genotoxicity (ISO 29200) ) or biochemical parameters for leaf fatty acid composition (ISO 21479) .).
In addition to the parameters considered in these standards, the homeostasis of physiological processes and
oxidative biochemical responses in plants can also become impaired when exposed to stressful environmental
conditions. As a result, the resilience and plasticity of plants can be deeply constrained, thereby affecting their
capacity to adapt, survive and thrive in terrestrial ecosystems.
The ISO/TS 25008 series includes two parts describing a set of physiological (ISO/TS 25008-1) and
[8]
biochemical (ISO/TS 25008-2) ) parameters (Figure 1(Figure 1),), of which the combined analysis can foster
a more holistic and comprehensive evaluation of the performance of plants exposed to soil pollutants or other
environmental stresses, comparatively to the analysis of isolated parameters.
v
ISO #####-#:####(X/DTS 25008-1:(en)
Figure 1— Schematic representation of the parameters covered
by Part 1 and Part 2 ofthe ISO/TS 25008 series
This document details methods for assessing relevant physiological processes in plants, namely associated
with oxidative damage (malondialdehyde content), cell membrane stability or permeability (electrolyte
leakage), plant water relations (relative water content), and metabolic changes (proline content)
(Figure 1(Figure 1).). Lipid peroxidation is a process occurring through several reactions in which reactive
oxygen species (ROS) attack unsaturated lipids, causing oxidative injury to plants’ cell membranes and the
[18] [9]
accumulation of several byproductsby-products, such as malondialdehyde (MDA) ). . MDA content has
[19]][[20]][[21] [10][11][12]
often been reported to increase in consequence of metal contamination , , as well as in the
[22] [13]
presence of other stress-inducing agents , , hence constituting a good indicator of oxidative stress in
plants.
The measurement of electrolyte leakage has been also used as an indicator of the structural integrity and
permeability of cell membranes, which can be disrupted by ROS produced under exposure to stress agents,
[19]][[23] [10][14] [24] [15] [25] [16]
likesuch as metals , , organic contaminants , , heat stress , and water deficit
[22][13]
conditions .
Leaf relative water content (C ) is regularly determined for characterizing plant-water relations, being a
RW
suitable indicator of changes in the water pool of plants that can compromise cellular metabolism. The levels
can vary between species and genotypes, and can increase with the accumulation of osmolytes likesuch
of C
RW
[17] [26] [22] [13] [27] [18] [26] [17]
as proline. . Leaf C is normally reduced under drought , , heat , , and salt stresses , , but
RW
[19][10]
tends to increase under metal contamination since metals can influence the water use efficiency by
[28][19]
plants .
Plants can produce molecules capable of reducing the impact of unfavorableunfavourable conditions. The
aminoacid proline is an osmolyte molecule frequently accumulated in higher amounts to enhance plants’
[19][10] [20] [29]
tolerance to different stress factors likesuch as metals and other pollutants, salinity and heat stress .
Moreover, the role of proline is multifunctional, as it can scavenge ROS and interfere in cellular oxidative
responses, stabilize cell structures, and mediate metabolic pathways activated for compensating the impacts
© ISO #### 2026 – All rights reserved
vi
ISO/DTS 25008-1:2026(E:(en)
[21] [30]
of abiotic stresses . Therefore, the analysis of proline content can provide a relevant overview of plant
health status, especially if complemented with the analysis of other biological responses.
Overall, changes (mostly an increase) in MDA content and electrolyte leakage can broadly better contribute
towards the assessment of soil contamination; whereas C and proline levels can often be more responsive
RW
to abiotic stressors in general. Notwithstanding, such a profile can vary according to the plant species and
their tolerance ranges. Therefore, the complementary analyses of these four physiological parameters in
conjunction is highly recommended, as it can provide an improved overview of plant responses to pollutants
and other common environmental changes, often co-occurring in the terrestrial compartment.
vii
ISO/DTS 25008-1:(en)
Soil quality — Responses of higher plants to environmental stresses
— —
Part 1:
Physiological parameters
1 Scope
This document describes a set of physiological parameters allowing the measurement of sublethal effects in
higher plants exposed to soil pollutants and other stressors (e.g. drought, nutrient availability, heat stress). It
is applicable to soils of unknown quality (e.g. from contaminated sites, amended soils or soils after
remediation), either in situ or following laboratory exposure assays. This partdocument specifies the methods
for analysing variations in physiological responses and oxidative damage that can be indicative of stress
symptoms in the leaves of higher plants, either monocotyledonous or dicotyledonous species.
2 Normative references
There are no normative references in this document.
3 Terms and definitions
For the purposes of this document, the following terms and definitions apply.
ISO and IEC maintain terminology databases for use in standardization at the following addresses:
— ISO Online browsing platform: available at https://www.iso.org/obp
— IEC Electropedia: available at https://www.electropedia.org/
3.1 3.1
blank control
technical treatment (3.4) for evaluating the performance of the procedure and quality of the reagents
3.2 3.2
negative control condition
treatment (3.4) consisting of the optimum condition for the physiological performance of the plant
Example EXAMPLE Sample of a reference soil and/or a control soil with a mixture of known solutions, to
which plants are exposed.
3.3 3.3
stress condition
treatment (3.4) consisting of the environmental stress condition under study
Note 1 to entry: Sample of a diluted and/or undiluted soil subjected to an environmental stress (e.g. contamination,
pollution, drought)).
3.4 3.4
treatment
condition considered in the test, experiment, or study (i.e. negative control, stress condition(s))
ISO/DTS 25008-1:(en)
3.5 3.5
reading blank
measurement done to set the spectrophotometer to zero optical density
4 Principle
This document specifies four methods to determine changes on lipid peroxidation ([malondialdehyde (MDA)
content),], cell membrane integrity (electrolyte leakage, E ), hydric relations (relative water content, C ),
L RW
and metabolic variations (proline content) in leaf extracts. MDA and proline contents are determined through
spectrophotometric methods, whilst E and C are based, respectively, on conductivity and weight changes
L RW
after a period of incubation under specific conditions. It is highly recommended to conduct the four methods
in conjunction to evaluate changes in the physiological status of plants that can be indicative of stress
symptoms, within different locations or exposure times along a growth period of the plants in the soils under
assessment. These methods are applicable in different experimental frameworks, either in site-specific
monitoring programs, in in situ or laboratory exposure assays. For in situ experiments the areas to compare
shall be exposed to the same climatic conditions (humidity, temperature, sunlight).
5 Reagents and material
5.1 Chemicals and solutions
5.1.1 5.1.1 Trichloroacetic acid (TCA) 0,1 % and 20 % (w/v).
®1)
For preparing 0,1 % (w/v) TCA (CAS: Registry Number 76-03-9) dissolve 0,5 g of the reagent in 400 ml of
water, mix to solubilize, and make up the volume to 500 ml in a volumetric flask. Store the solution at (4 ± 1) °C
protected from light. Remove the solution from the cooler approximately 30 minutes before use to warm up
to room temperature.
5.1.2 5.1.2 Solution of TCA 20 % / Thiobarbituric acid (TBA) 0,5 % (w/v).
Dissolve 100 g of TCA in 250 ml of water by heating at (40 ± 2) °C covered with aluminumaluminium foil until
complete solubilization of the reagent. Cool down the solution to room temperature.
-‒1
Dissolve 2,5 g of TBA (CAS: 504-17-6) in approximately 5-10 ml of sodium hydroxide 0,1 mol l (CAS Registry
®1
Number 1310-73-2). Add approximately 50 ml of water, mix, and add to the 20 % TCA solution initially
prepared. Heat the mixture at (40 ± 2) °C in the dark until complete dissolution. Cool down the solution and
then make up the volume to 500 ml. Store the TBA--TCA solution at (4 ± 1) °C up to 1 week in the dark, or
freeze at (‒20 ± 1) °C for longer periods of storage.
5.1.3 5.1.3 Water.
Sterilized [at (121 ± 1) °C and 15 psi for 20 minutes] or non-sterilized, as specified in the respective methods,
‒1
with a conductivity of (0,06 ± 0,02) µS cm (i.e. ultrapure water; recommended for electrolyte leakage)
‒1
or < 5 µS cm (i.e. distilled water; can be applied in the other methods).
5.1.4 5.1.4 MDA standard (1,1,3,3-Tetramethoxypropane;, TMP).
1)
Chemical Abstracts Service (CAS) Registry Number® is a trademark of the American Chemical Society (ACS). This
information is given for the convenience of users of this document and does not constitute an endorsement by ISO of the
product named. Equivalent products may be used if they can be shown to lead to the same results.
Chemical Abstracts Service (CAS) Registry Number® is a trademark of the American Chemical Society (ACS). This
information is given for the convenience of users of this document and does not constitute an endorsement by ISO of the
product named. Equivalent products may be used if they can be shown to lead to the same results.
© ISO #### 2026 – All rights reserved
ISO/DTS 25008-1:(en)
MDA is not a stable molecule, but TMP (CAS : 102-52-3) can be converted into MDA by acidic hydrolysis,
‒1 ‒1
thereby being used as aan MDA standard. Prepare a standard stock solution of 1 mg ml (or 6,09 µmol ml )
-‒1
by adding 10 µl of TMP to 10 ml of 0,1 mol l HCl. The stock solution can be stored at (4 ± 1) °C protected
‒1 ‒1
from light up to one week. A working solution of 10 µg ml (or 60,9 nmol ml ) should be freshly prepared
before doing the standard curve by diluting 100 µl of the stock solution in 9,90 ml of water.
5.1.5 5.1.5 Sulfosalicylic acid 3 % (m/v).
Dissolve 3 g of 5-sulfosalicylic acid (CAS : 5965-83-3; 2-hydroxy-5-sulfobenzoic acid) in 80 ml of water and
make up the volume to 100 ml. Store the solution at room temperature for weeks.
5.1.6 5.1.6 Glacial acetic acid (CAS : 64-19-7).
5.1.7 5.1.7 Ninhydrin acid solution.
-‒1
Add 1,25 g ninhydrin (CAS : 485-47-2) in 30 ml glacial acetic acid (5.1.6(5.1.6)) and 20 ml of 6 mol l
phosphoric acid (CAS RN 7664-38-2), and stir by warming up the solution (approximately 50 °C to 60 °C) until
dissolved. Store the solution at (4 ± 1) °C in the dark for up to 1 week.
5.1.8 5.1.8 Toluene (CAS RN 108-88-3).
Use the reagent as is.
5.1.9 5.1.9 L-proline standard solutions.
‒1
Prepare a 1 mg ml standard stock solution by dissolving 50 mg of L-proline (CAS RN 147-85-3) in 50 ml of
water. Make aliquots of 2 ml and store at (–20 ± 1) °C protected from light up to one month. Freshly prepare
‒1 ‒1
a 200 µg ml working solution of L-proline standard, by diluting 1 ml of the 1 mg ml stock solution in 4 ml
of water. Protect the working solution from light and keep it at (4 ± 1) °C until use.
5.2 Equipment
5.2.1 5.2.1 Analytical scale with readability of 0,001 g.
5.2.2 5.2.2 Centrifuge adaptable for eppendorfsmicrocentrifuge tubes, falcon and/or glass tubes.
5.2.3 5.2.3 Thermostatic water bath.
5.2.4 5.2.4 Spectrophotometer UV-Vis for reading absorbances at 520 nm, 532 nm, and 600 nm.
5.2.5 5.2.5 Orbital shaker.
5.2.6 5.2.6 Conductivity meter.
5.2.7 5.2.7 Autoclave.
5.2.8 5.2.8 Incubator or oven (, working up to (70 ± 2) °C).
5.2.9 5.2.9 Vortex.
5.3 Other materials
5.3.1 5.3.1 Mortar and pestle made of porcelain.
5.3.2 5.3.2 Plastic falcon tubes of 14 ml to 15 ml.
5.3.3 5.3.3 Micropipette of 5 000 µl, 1 000 µl, 200 µl, 20 µl and 10 µl, and their respective tips.
ISO/DTS 25008-1:(en)
5.3.4 5.3.4 Glass test tubes with lid of 10 ml to 14 ml resistant to centrifugation and (100 ± 1) °C
incubations.
5.3.5 5.3.5 Glass or quartz cuvettes of 1 ml or 3 ml.
5.3.6 5.3.6 Glass vials with lid of 40 ml (approximately 3 cm diameter × 8 cm height) resistant to
autoclaving.
5.3.7 5.3.7 Sterile absorbent paper [sterilization at (121 ± 1) °C and 15 psi for 20 minutes].
5.3.8 5.3.8 Plastic petri dishes with 90 mm of diameter.
5.3.9 5.3.9 Plastic microtubes (i.e. eppendorfsmicrocentrifuge tubes) of 1,5 ml and 2 ml.
6 Plants and sampling procedures
The described methods can be applied to higher plants, either monocotyledonous or dicotyledonous, being
some examples,for example crop plants (e.g. corn, tomato, lettuce),) and trees (pine, willow, ash, olive).
The methods can be used to assess the plant physiological status either along several sampling time intervals
and/or at the end of a growth period, or both, under soils which quality is being assessed. The frequency of
sampling depends on the goal, type and/or experimental set-up (i.e. monitoring program, in situ or laboratory
assay) of the study, as well as the exposure period performed. Seedlings and adult plants resulting from the
performance of different ISO standard tests (e.g. seedling emergence test, chronic toxicity test) can be used,
as far as appropriate controls and control conditions are established during the experiments, for comparison
means.
For assays conducted under controlled conditions (i.e. laboratory and greenhouse experiments), at least five
leaves (or a piece of leaf), one per plant replicate, should be harvested per treatment (e.g. control soil, soil
sample or dilution), parameter or method, and sampling time (if applicable). The amount of leaf tissue per
plant replicate necessary to conduct the 4 measurements or methods can range between 2 g and 3 g,
depending on the type or size of the leaf, and on its fresh biomass. Considering that the analytical methods are
invasive, additional plant replicates can be implemented per treatment if several sampling times are
conducted.
For on-site monitoring studies aiming to obtain an overview of the phytocenosis, the larger the number of
species sampled, the more representative the results are of the “soil quality” for the overall phytocenosis.
Hence, in this case, the various areas of the site are firstly prospected, and several species of plants to sample
are chosen among the most representative of and, to the extent possible, the more common to all areas.
Nevertheless, for the assessment of agricultural practices, for site-specific risk assessment studies, or for in
situ assays, only one plant species can be of interest and sampled, namely the cultivated crop or the selected
test plant. For risk assessment and in situ assays, a reference versus a contaminated, remediated, or
stress--impacted area or soil should be sampled or tested. Irrespective of the on--site study approach, one leaf
(or a piece of leaf) of at least 5 individuals per species is collected per area, by doing the following:
— do not consider leaves under hydric (drought) or biotic (pathogens) stress, only green leaves shall be
harvested;
— harvest leaves on plants of similar size. Consequently, consequently, harvesting leaves from small plants
on one area and leaves from tall plants on another shall not be undertaken;
— as a precautionary measure, harvest only mature leaves and disregard developing ones;
— when only a part of leaves is sampled from a given species, harvest the same part of the leaves (for example
the distal part for example) for all individuals;
© ISO #### 2026 – All rights reserved
ISO/DTS 25008-1:(en)
— as a precautionary measure, harvest all the plants within 2 to 3 hours.
For all experimental approaches, the harvested leaves should be analysed immediately, particularly for MDA
content, EL and C . For the analysis of proline content, either use the freshly harvested leaves or, if not
RW
possible, snap freeze them in liquid nitrogen, and store at (–80 ± 1) °C until initiating the analysis procedure.
7 Methods for physiological stress assessment
7.1 General
The methods detailed in 7.2sub-clauses 7.2 to 7.57.5 are summarized in the Tables A.1Tables A.1 to A.4A.4
and in Figures A.1Figures A.1 to A.4A.4 in Annex AAnnex A.
7.2 MDA content measurement
7.2.1 Procedure to determine MDA levels
MDA is a product of lipid peroxidation, which results from the degradation of cell membrane integrity.
Thereby, the MDA content in monocotyledonous or dicotyledonous plant leaves is indicative of the lipid
31][32 [22][23]
peroxidation level . . The principle of the assay relies on the reaction of one molecule of MDA with
2 molecules of TBA under high temperature, forming the MDA-2TBA adduct of pink colour that is detectable
at 532 nm.
Besides the testing of leaf samples from the different experimental treatments (e.g. negative control and stress
condition) it is recommended to include a blank control of the procedure, in which the leaf extract is replaced
by water (5.1.3(5.1.3).).
Homogenize (350 ± 100) mg (use an analytical scale, 5.2.15.2.1)) of a fresh leaf per plant replicate (from at
least 5 plant replicates) in 5 ml of 0,1 % TCA (5.1.1(5.1.1),), using a mortar and a pestle (5.3.1(5.3.1).). Transfer
the homogenate of leaf extract to a falcon tube (5.3.2(5.3.2)) and centrifuge (5.2.2(5.2.2)) at 10 000g and
(4 ± 1) °C for 10 minutes. Pipette (5.3.3(5.3.3) 1 ) 1 ml of the supernatant (or 1 ml of water for the blank
control) to a glass test tube with lid (5.3.4(5.3.4)) and add 4 ml of TCA/TBA solution (20 %/0,5 %;
5.1.25.1.2).). Incubate the mixture at (95 ± 1) °C for 30 minutes in a water bath (5.2.3(5.2.3)) to form the MDA-
TBA adduct, and immediately after, cool it down in iced-cold water. Centrifuge the tubes at 10 000g and
(4 ± 1) °C for 10 minutes. The absorbance of the supernatant is spectrophotometrically measured at 532 nm
and 600 nm (5.2.4(5.2.4)) in glass or quartz cuvettes (5.3.5(5.3.5).).
The MDA equivalent is computed by subtracting the absorbance reading at 600 nm (A ; removing the
influence of turbidity) to that measured at 532 nm (A ), and using a molar extinction coefficient
−1 −131 [22]
of ε = 0,155 M cm . . The following Formula (1)Formula (1) can be applied:
E = ((A – A ) / 0,155 × L) × F / W , (1)
MDA 532 600 D LF
where
‒1
-
E is equivalents of MDA, expressed in µmol mg ;
MDA
A is absorbance measured at 532 nm or 600 nm;
L is the cuvette width (1 cm));
F is the sample dilution factor (1 if sample is not diluted));
D
W corresponds to the leaf fresh weight (in mg) used for preparing the homogenates.
LF
Alternatively, the MDA concentration can be determined from the standard curve, by replacing the y
(corrected A ) in the equation to derive the x value (MDA concentration) (see 7.2.2cf. sub-clause 7.2.2).). If
the samples were previously diluted, then the obtained concentration of MDA should be multiplied by the
dilution factor. Express the final value of MDA concentration per mg of leaf fresh weight.
ISO/DTS 25008-1:(en)
7.2.2 MDA standard curve
‒1
To create the MDA standard curve, prepare several dilutions of the TMP working solution (10 µg ml ;
5.1.45.1.4)) with water. Table 1Table 1 presents the volume of TMP working solution and water (5.1.3(5.1.3))
that can be used to obtain a range of standard concentrations, which can be adjusted according to the MDA
values in the samples under analysis.
Table 1 -— Preparation of TMP standard concentrations for generating the MDA standard curve
V V per V per
WS TWS dH2O
[TMP] Concentration of TPM
replicate replicate
-‒1 -‒1
(µg ml ) (µmol ml ) (µM) (ml) (ml)
0 0 0 0 1
0,031 0,0002000 2 0,2 0,003 0,997
0,063 0,0004000 4 0,4 0,006 0,994
0,13 0,0008000 8 0,8 0,013 0,988
0,25 0,0015001 5 1,5 0,025 0,975
0,50 0,003 3,0 0,050 0,950
1 0,006 6,1 0,100 0,900
2 0,012 12,2 0,200 0,800
4 0,024 24,4 0,400 0,600
Total volume for 3 replicates (ml) 2,39 24,61
V volume of TPM working solution
TWS
VdH2O volume of distilled water
-1 -1
[TMP] — concentration of TMP (in µg ml , µmol ml , µM); VWS - Volume of TMP working solution; VdH2O - volume of
distilled water
Pipette 1 ml of TMP working solution to the respective test tube (5.3.4(5.3.4),), in triplicate (i.e. 3 replicate
tubes per sample). Add into each test tube 4 ml of TCA/TBA solution (5.1.2(5.1.2)) and incubate at (95 ± 1) °C
for 30 minutes. Afterwards, cool it down in an iced-cold water bath. Centrifuge (5.2.2(5.2.2)) the tubes
at 10 000g and (4 ± 1) °C duringfor 10 minutes. Read the absorbance at 532 nm and 600 nm, against a blank
‒1
control (i.e. concentration of 0 µg ml ; Table 1Table 1).).
Subtract the absorbance reading at 600 nm from that at 532 nm. Calculate the average ± standard deviation
of the corrected absorbance at 532 nm, and plot the obtained value for each standard (yy’ axis) against the
concentration of MDA standard (xx’ axis). Adjust a linear model to the data points and generate the equation
of the standard curve (i.e. y(x) = ax + b).
© ISO #### 2026 – All rights reserved
ISO/DTS 25008-1:(en)
7.3 Electrolyte leakage measurement
A.1 Electrolyte leakage measurement
Electrolyte leakage provides an indication of the potential degree of cell membrane injury in plant tissues. .
[15][24]][33
In order to perform this analysis, use at least five leaves (one per plant replicate) from each treatment and
measuring time (if the analysis is conducted at different time points), and cut them in 1-cm fragments (total
of 100 mg ± 10 mg) if the leaves are longer. Immerse these leaf fragments for 15 min (in the dark at room
temperature) in individual glass vials (5.3.6(5.3.6)) containing 10 ml of sterile ultrapure water, as to wash out
cell debris from the cutting of leaves, and other residues. Discard the washing water and add 20 ml of sterile
ultrapure water. Incubate for 24 h at room temperature in the dark under 80 r/min agitation in an orbital
shaker (5.2.5(5.2.5).). Measure the conductivity in water before (σ ) and at the end (σ ) of the 24h-incubation
0 f
period with a conductivity meter (5.2.6(5.2.6;; the conductivity electrode should be washed with sterile
ultrapure water and dried with sterile absorbent paper (5.3.7(5.3.7)) in between the readings of different
samples). Afterwards, autoclave (5.2.7(5.2.7)) the leaf samples at (121 ± 1) °C and 15 psi for 15 minutes. Cool
down to approximately 25 °C and measure the maximum or total conductivity (σ ). The electrolyte leakage
m
(E ) is calculated by Formula (2)Formula (2)::
L
E (%) = [(σ – σ ) / (σ σ – σ )] × 100 (2)
L f 0 m m 0
7.37.4 C measurement
RW
Leaf C indicates the water status in plants and is computed by the weight differences in the mass of leaves,
RW
34][35][36 [25][26][27]
before (fresh weight;, W ) and after drying (dry weight;, W ) at (60 ± 1) °C for 72 h . . This
F D
parameter should be preferably applied to dico
...